In March 2024, I will publish the Guide to the Indian Shrimp Industry. As some of you may know, my career in shrimp started in India. Some 12 years ago, I lived in Chennai, in the south of India, to study the strategic behavior of Indian shrimp exporters. Since that time, I’ve stayed closely connected with the Indian industry, traveled to the country dozens of times, and made many good friends. Over the years, the passion in the industry and the hundreds of thousands of livelihoods it supports have truly inspired me.
As the industry is so huge and fragmented, I decided to produce the upcoming report to provide an outsider’s perspective on the Indian shrimp industry – something that’s not available today. It’ll be a 100-150 page publication with chapters on each segment of the industry’s value chain, from feed and post-larvae to farming, processing, and distribution. There’ll be chapters on sustainability certification, the start-up landscape, and the rise of P. monodon. The report will conclude with a collection of profiles of the largest companies from each segment of the value chain. Whether you’re looking for a general overview of the industry or a deep dive into a specific part of the value chain, you’ll be sure to find a trove of information.
Perhaps good to know: the report will be entirely FREE. It has been made possible by an amazing group of friends and sponsors. These are Apex Frozen Foods, AquaConnect, the Aquaculture Stewardship Council, AquaExchange, Deepak Nexgen, Devi Fisheries, Devi Sea Foods, DSM-Firmenich, Phileo by Lesaffre, Sandhya Aqua, Vaisakhi Bio-Marine, and Vaishnavi Aquatech.
This blog will give you a taste of the level of detail that you’ll find in the report by providing you with the chapter on India’s shrimp markets. Stay tuned and spread the word about the upcoming report!
In 2023, the Shrimp Blog is supported by: Inve Aquaculture, Taprobane Seafoods, DSM Animal Nutrition, Zeigler Nutrition, aquaconnect, Bioiberica, Megasupply, American Penaeid, and Omarsa.
India’s Shrimp Export Markets
Before diving deep into India’s shrimp farming sector, let’s examine India’s shrimp markets. Around 90-95% of India’s shrimp is currently exported, and overseas markets likely remain the most important sales venue for India’s processors. However, many believe that the domestic market holds enormous potential to relieve India’s farmers from their dependency on the highly volatile export market. In this blog, we’ll take a look at India’s overseas markets. In the Guide to the Indian Shrimp Industry, you’ll also find a chapter on India’s domestic market.
Key Insights:
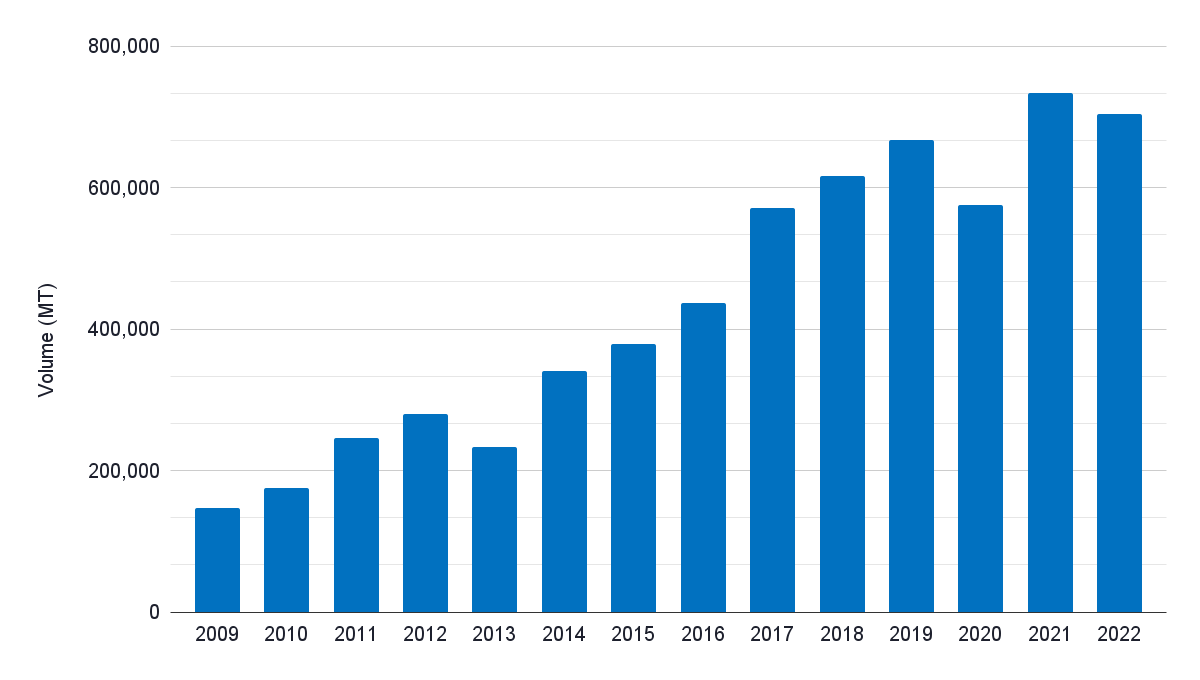
- In 2021, India’s shrimp exports peaked at 704,160 MT. This amounts to a live weight equivalent of around 1m MT of shrimp. In 2022 and 2023, growth stagnated due to oversupply in the global market and resulting price drops.
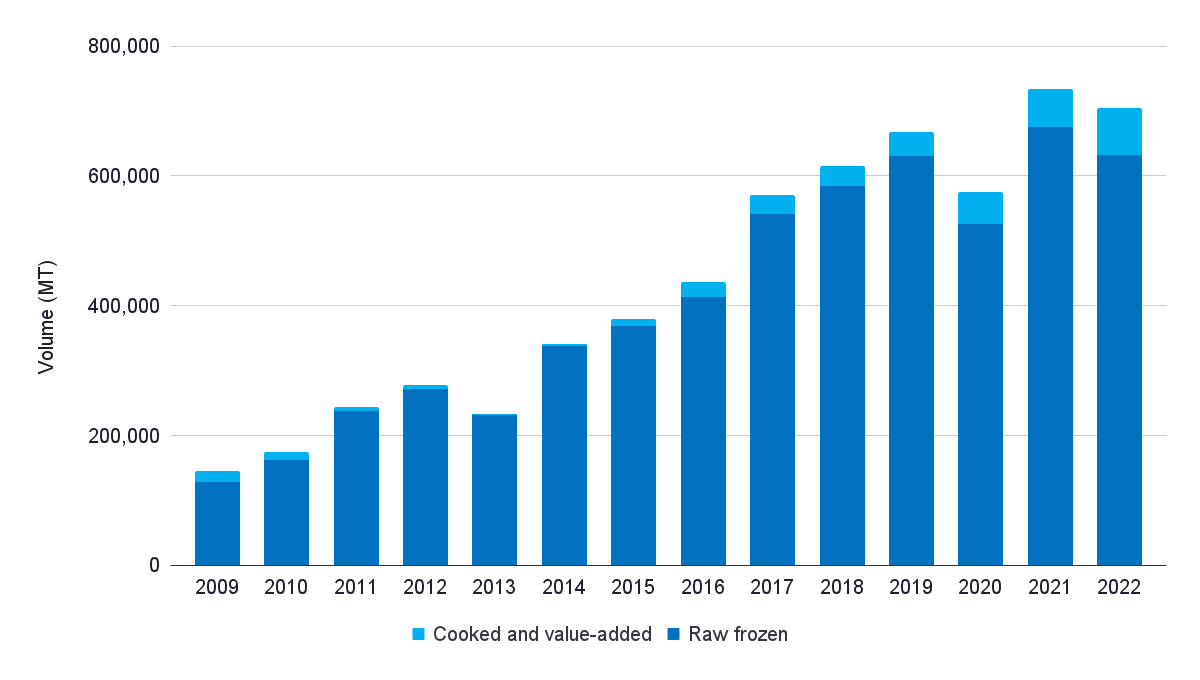
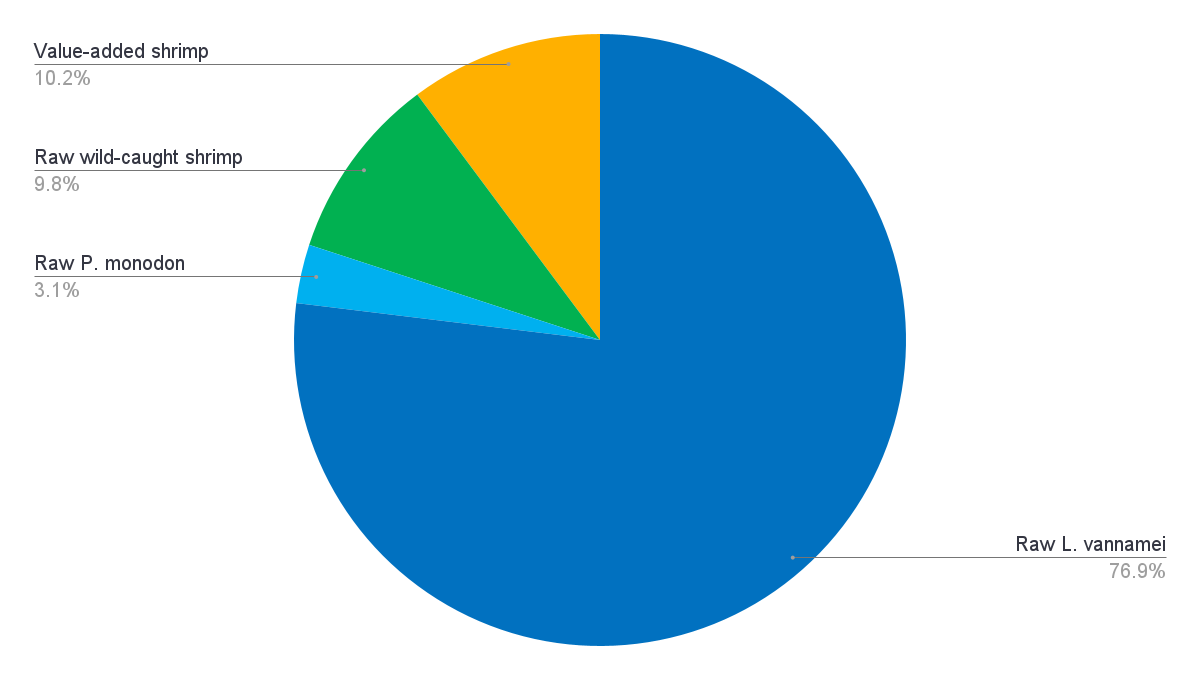
- In 2022, 76% of exports comprised raw L. vannamei, 10% raw wild-caught, and 4% raw P. monodon. 10% of total exports consisted of cooked and breaded shrimp, of which around 70% was L. vannamei.
- The US is India’s largest export market, accounting for around 40-50% of total exports. While India remains the US’s largest shrimp supplier, Ecuador is gaining ground—and market share. This is especially the case in the headless shell-on segment, and to a lesser extent in the peeled segment.
- In order of significance, other markets that imported more than 10,000 MT of shrimp from India are China, the EU, Vietnam, Japan, the Middle East and Africa, Canada, Russia, and the UK.
- Also in these markets, India is facing increased competition from Ecuador in the headless shell-on and peeled market segments, which India used to dominate.
- Having made recent investments in cooking lines and breading facilities, India expects to increase its exports of cooked and breaded products over the next couple of years and gain market share from countries such as Indonesia, Thailand, and Vietnam.
- In the future, Indian domestic consumption may grow and offer an alternative sales venue for India’s shrimp farmers. However, its short-term potential shouldn’t be overestimated as developing this market will take time.

The Export Landscape
Volume and Value
Source: ITC Trademap
Source: ITC Trademap
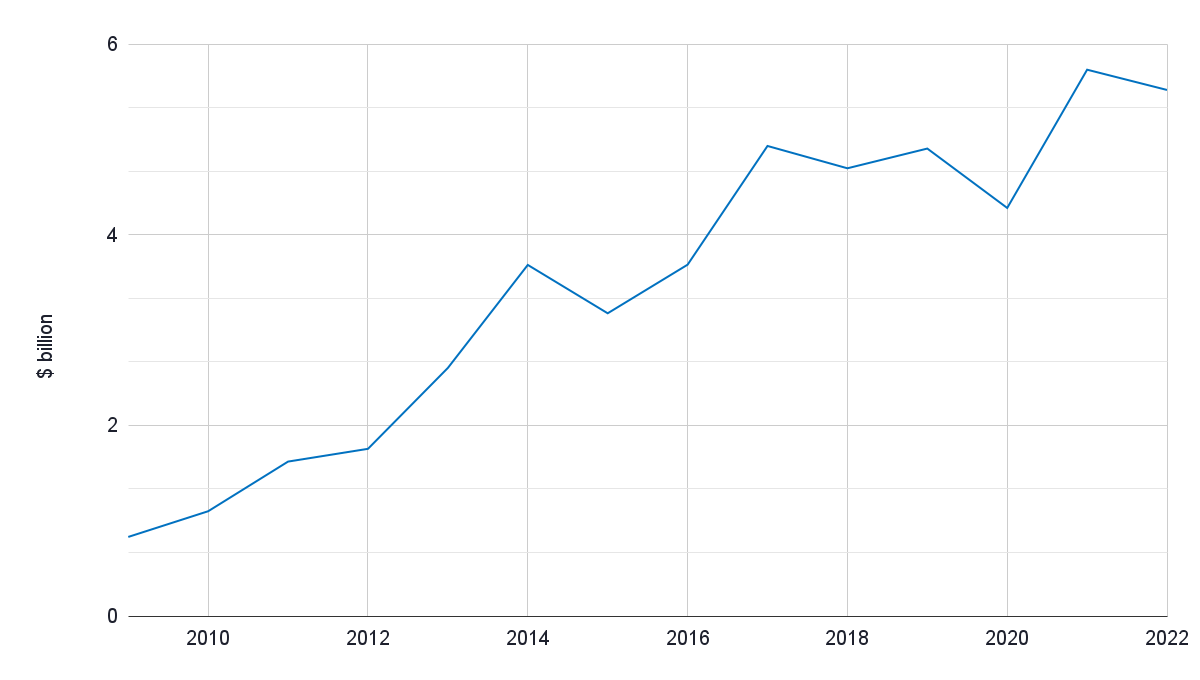
Coming from a volume of less than 200,000 MT worth just over $1bn in 2010, the growth of India’s exports has been enormous. In the peak year 2021, India recorded an export volume of 734,160 MT at a value of $5.73bn, making shrimp India’s most valuable seafood export product.
From 2012 to 2019, shrimp exports recorded a 19% compound annual growth rate (CAGR). The growth resulted primarily from the rapid expansion of L. vannamei production. In 2020, exports temporarily dropped amidst COVID-19-related logistical challenges. But in 2021, the export volume saw a 28% surge, and the industry seemed to be back on its trajectory of growth. The 2021 peak was driven by strong retail demand in the US and overseas markets, and with the high prices at that moment, the export value in 2021 increased by 34% to $5.73bn.
In 2022 and 2023, when prices dropped due to oversupply, growth stagnated. At the end of 2023, prices are just above the level of 2020, when COVID-19 supply chain disruptions caused panic harvests. If we would adjust these prices for inflation, shrimp prices today are at their lowest point. This hindered further growth. Although some may have expected the export volume to drop more significantly, the fact that growth has now really stalled illustrates the challenges that the industry faces.
Species and Products
Source: ITC Trademap
Source: Indian Ministry of Commerce
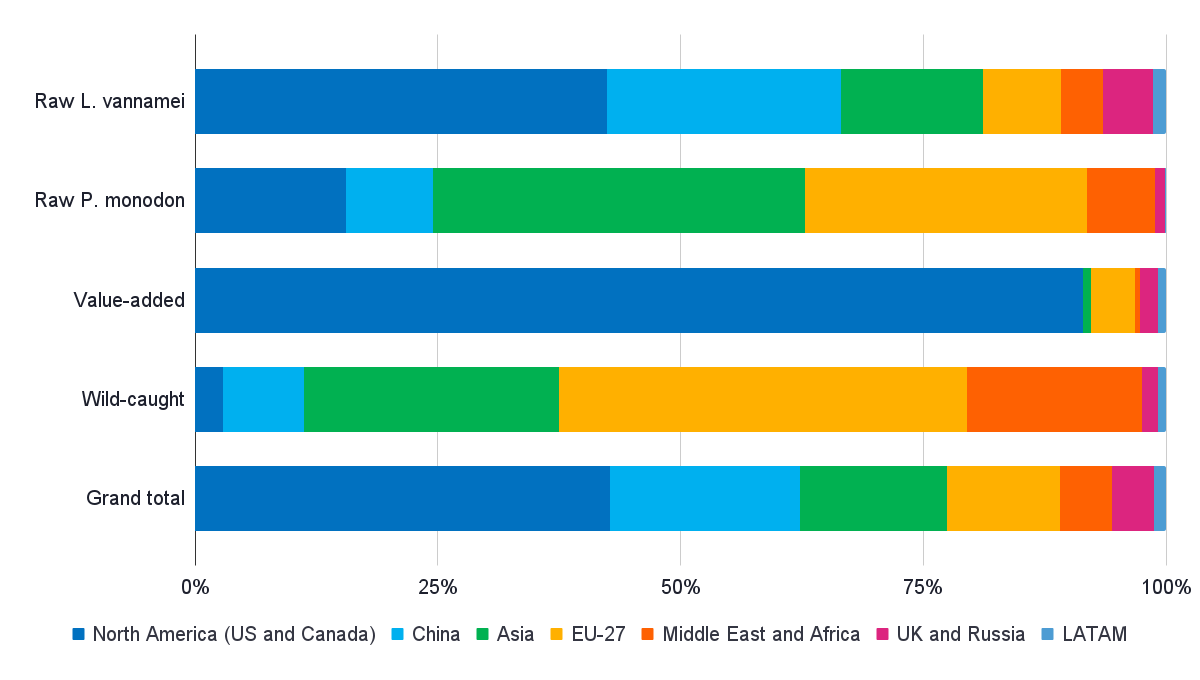
India’s shrimp exports include a range of wild-caught and farmed species. Wild-caught shrimp exports include wild-caught Asian pink shrimp and a variety of Penaeus species. Farmed shrimp exports are limited to L. vannamei and P. monodon. Most shrimp, 90% of total exports, is raw frozen (exported under HS 030617); the remainder is exported as cooked and breaded products (exported under HS 160521/29).
Since April 2020, Indian customs provide a breakdown by HS code. This data allows us to break down India’s exports of raw frozen shrimp to the species level. In 2022, L. vannamei shrimp exports accounted for 86% of total raw frozen exports, wild-caught shrimp accounted for 11%, and farmed P. monodon for only 3%. Although exact data for value-added exports isn’t available, L. vannamei likely accounts for around 70%, and the remainder is made up of wild-caught shrimp. While exports of wild-caught shrimp are stable at best, exports of L. vannamei and P. monodon are growing.
Exact data on product types (head-on shell-on (HOSO), headless shell-on (HLSO), peeled, and breaded) is unavailable. But, based on an assessment of the product basket for each of India’s export markets, a rough estimation suggests that peeled shrimp accounts for around 50-55% and HLSO shrimp for about 40-45% of total exports. The rest is a mix of HOSO and breaded products. The exports of breaded products will rapidly increase over the next couple of years—read the chapter on processing in the Guide to the Indian Shrimp Industry to find out why.

Markets
Source: ITC Trademap
Source: Indian Ministry of Commerce
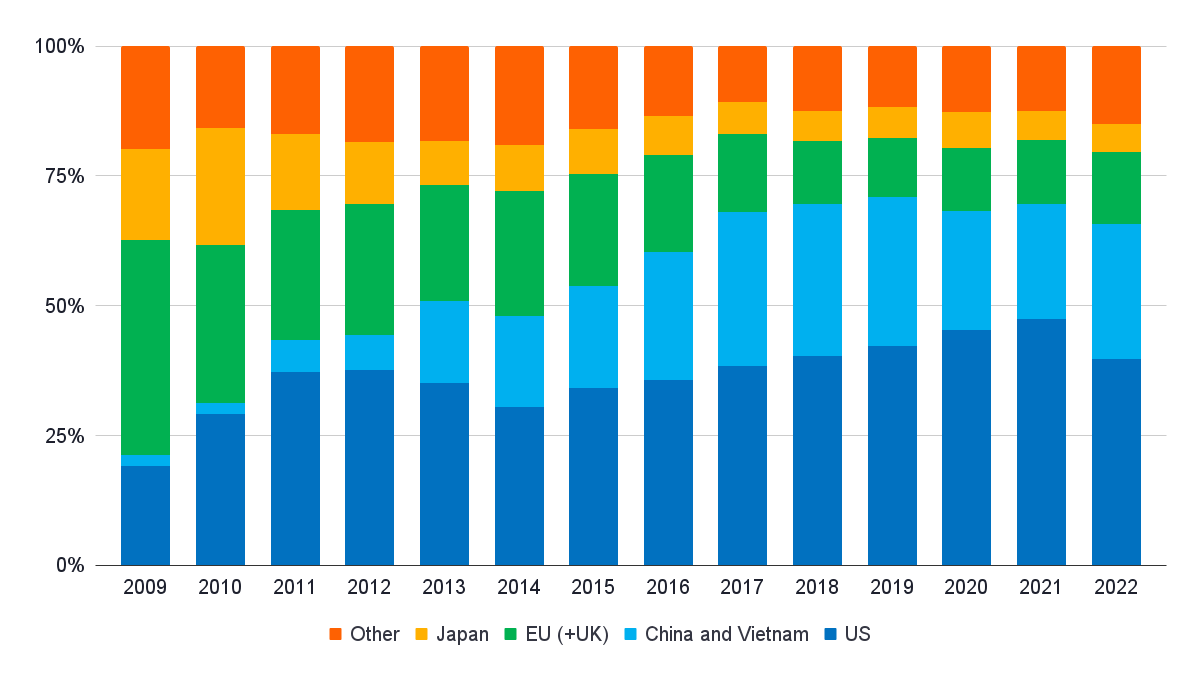
India’s shrimp exporters mainly depend on the US market. From 2013, that dependency grew to almost 50% before dropping to 40% in 2022 and 2023. During the same decade, exports to China and Vietnam grew. Figures of the two countries are combined in Figure 5 because exports to China were initially shipped through Vietnam. Nowadays, most shipments destined for China are sent directly, and shipments to Vietnam are used for reprocessing activities. In this section, we’ll look at nine of India’s biggest export markets, to which it exports more than 10,000 MT each year.
The US
Source: NOAA
Source: NOAA
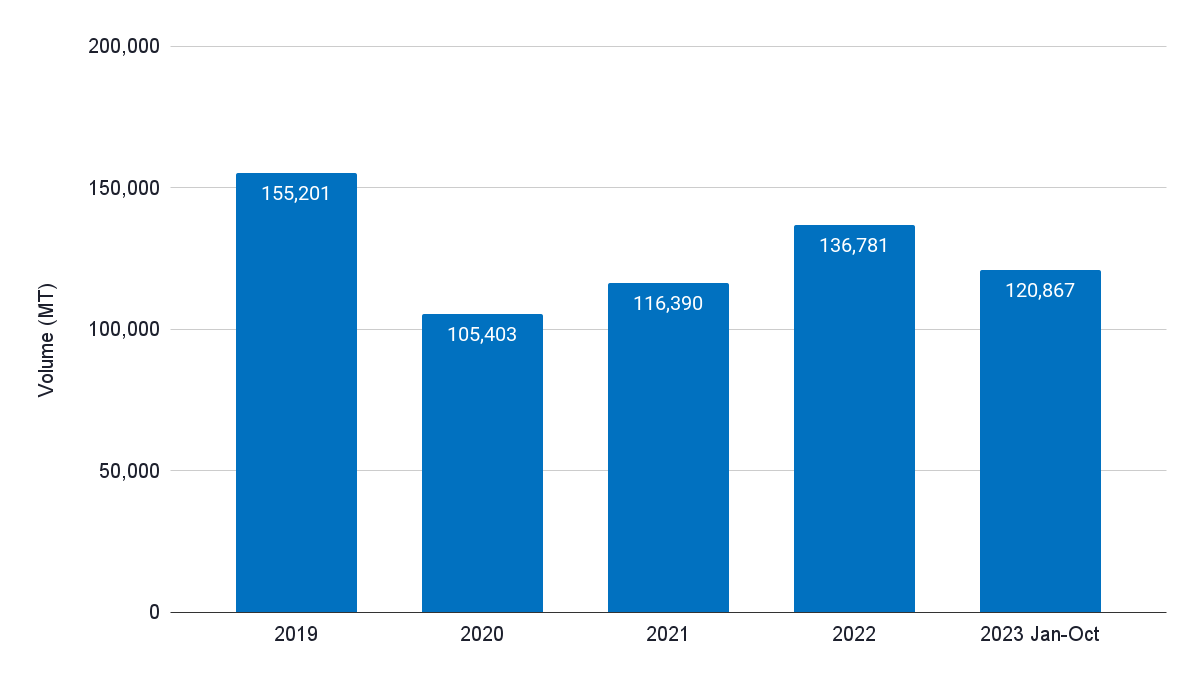
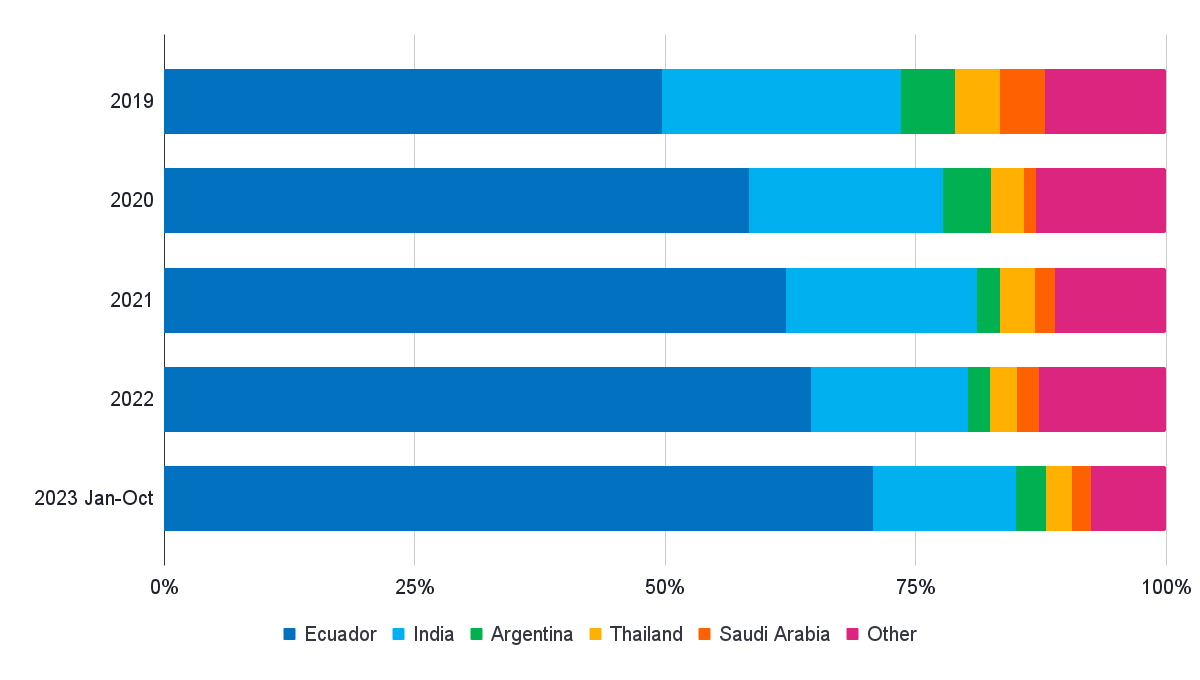
Since 2013, India has been the largest shrimp supplier to the US. US imports have fluctuated since 2019. Exports dropped from 300,672 MT in 2019 to 271,735 MT in 2020 at the start of the COVID-19 pandemic. Amidst COVID-19 lockdowns and strong retail demand in 2021, exports to the US jumped back to 340,387 MT. Then, in 2022, due to oversupply, exports dropped yet again—to 303,557 MT. In October 2023, exports were 5% behind the same period in 2022, and the 2023 year total will likely conclude at around 290,000 MT.
Ecuador, on the other hand, has kept growing its exports to the US, from 82,968 MT in 2019 to 199,813 MT in 2022 (a growth of 240%), and a similar volume is expected in 2023. While India remains the US’s largest shrimp supplier, Ecuador’s success has resulted in India’s market share dropping from 43% in 2019 to 38% in 2023 and Ecuador’s market share increasing from 12% to 26% over the same period. Indonesia, Vietnam, and Thailand complete the top 5 of the US’s largest suppliers, which all saw their market shares increase: from 19% to 18%, 6% to 8%, and 6% to 4%, respectively. The five suppliers together control 94% of US shrimp imports. Let’s have a more detailed look at the different product categories that these top players supply to the US to understand the underlying dynamics.
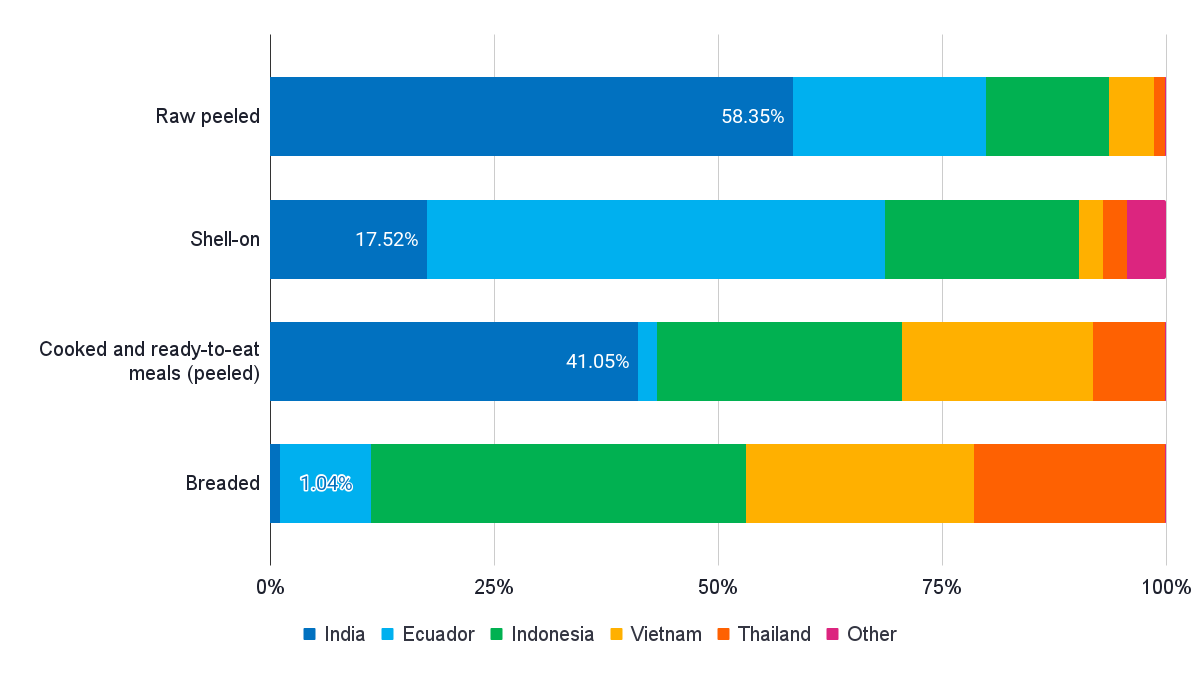
Headless Shell-On
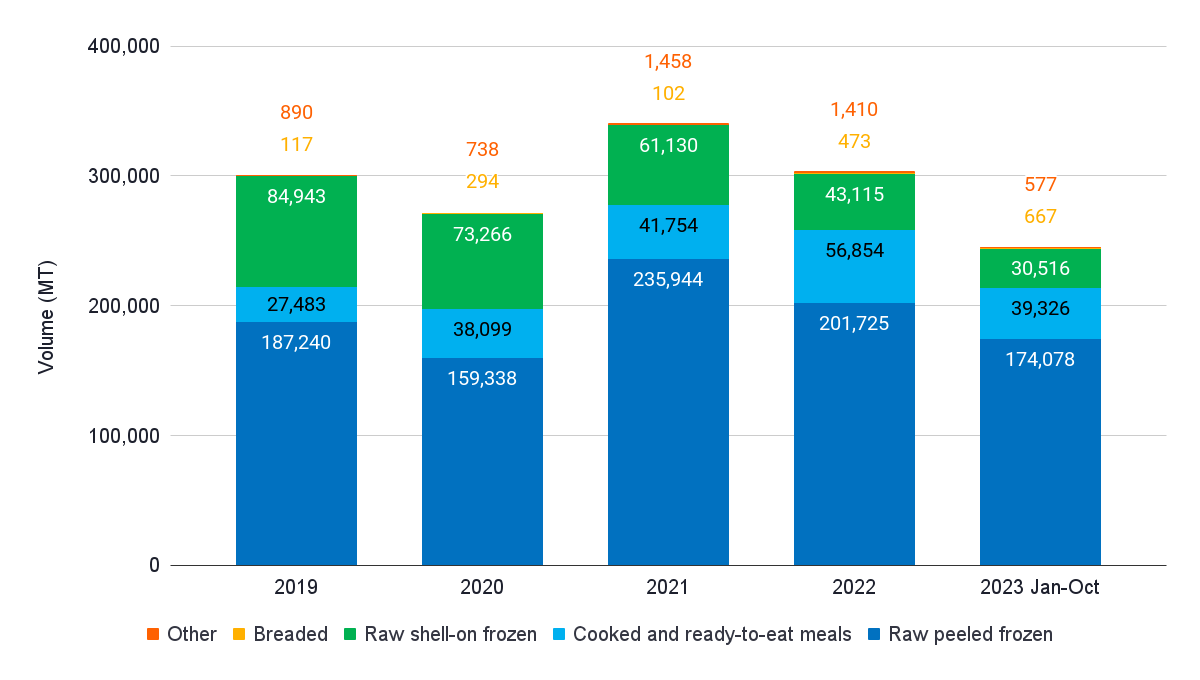
While the US’s total imports in the category of HLSO shrimp increased slightly, India’s export volume plummeted from 84,943 MT in 2019 to 43,114 MT in 2022. Its market share, too, dropped: from 35% in 2019 to 17% in 2022. Meanwhile, Ecuador’s exports of HLSO shrimp grew significantly, from 48,865 MT in 2019 to 110,019 MT in 2022, and its market share increased from 20% to 43%. If this trend continues, Ecuador’s market share in this category may exceed 50% in 2023. Taking all of this into account, in 2023, Indonesia is likely to have become the US’s second largest supplier of HLSO shrimp—resulting in a third position for India.
Raw and Cooked Peeled
If we assume that practically all of the US’s imports of cooked shrimp and ready-to-eat meals consist of peeled products, the peeled shrimp category grew from around 400,000 MT in 2019 to 550,000 MT in 2021 and then dropped back to 512,000 MT in 2022. Around 370,000 MT of the total in 2022 consisted of raw peeled shrimp, and the remainder of cooked peeled shrimp. India is by far the largest supplier to the US of peeled shrimp. Its market share has fluctuated over the years: from 54% in 2019 to 47% in 2020, 50% in 2021 and 2022, and back to 53% in 2023.
In the raw peeled segment, India’s market share dropped from 61% in 2019 to 56% in 2023. Ecuador’s exports of raw peeled shrimp to the US grew. Its market share went up from 10% in 2019 to 21% in 2023, overtaking Indonesia as the second largest supplier of raw peeled shrimp as of 2021. Indonesia’s market share decreased from 16% in 2019 to 13% in 2023. The only other major supplier of raw peeled shrimp to the US is Vietnam, which saw its market share grow slightly: from 3% in 2019 to 5% in 2023.
A segment where India has done quite well over the years is the cooked peeled segment: India’s market share went up from 30% in 2019 to 40% in 2022. Ecuador doesn’t play a significant role in cooked shrimp, and had a market share of just 3% in 2023. The leading players that India competes with in this segment are Indonesia, Vietnam, and Thailand, which have market shares of 26%, 21%, and 67%, respectively. With many new cooking lines recently installed, India will likely attempt to take market share from these players over the next few years.
Breaded
Although the segment of breaded shrimp is small, it’s steadily growing. Imports increased from around 50,000 MT in 2019 to about 71,000 MT in 2022 and may account for about 60,000 MT in 2023. Traditionally, China was the largest supplier to the US in this segment, but amidst the trade feud between China and the US, Indonesia, Vietnam, and Thailand have taken over much of these supplies. Today, these three suppliers have market shares of 40%, 23%, and 20%, respectively. China’s market share dropped to 6%, and Ecuador has an 8% market share. With just a 1% market share, India’s role here has been insignificant. Still, with the recent construction of several breading facilities in the US and other markets, India will try to gain market share over the next couple of years.

Anti-Dumping Duties
The US started to impose anti-dumping duties on Indian shrimp in 2004. The number of Indian exporters active in the US market dropped from more than 200 in 2004 to only around 75 in 2009. The regulations required Indian exporters to set up import businesses in the US, and Indian shrimp exporters had to deeply integrate into the US import landscape—which, over time, led to these exporters building strong relationships with US retailers and food service companies.
After the 17th administrative review of the current duties on Indian shrimp in 2023, the dumping rate for Indian exporters increased from 3.76% to 3.88%. Anti-dumping duties for Chinese, Vietnamese, and Thai exporters also remain in place. Ecuador and Indonesia have so far been excluded from these duties. However, this may change with a recent petition submitted by the American Shrimp Processors Association (ASPA) in October 2023 to investigate dumping allegations for warmwater shrimp.
The ASPA has filed petitions with the US Department of Commerce (DoC) and the US International Trade Commission (ITC), seeking anti-dumping duties on imports of frozen warmwater shrimp from Ecuador and Indonesia to protect the US market from shrimp being dumped for prices below production cost. Similarly, the ASPA has petitioned for countervailing duties being applied to shrimp imports from Ecuador, India, Indonesia, and Vietnam that have benefitted from government subsidies in the country of origin. Read a review of the petition by US lawyer Akin Gump here.
Although chances are that the ruling will be unfavorable for the shrimp suppliers under investigation, Akin Gump explains that if the ITC and DoC make a preliminary decision in favor of the petitioners, US importers will be required to post cash deposits in the amounts of the estimated anti-dumping duties and countervailing duties for all shrimp shipments from the date the decision is announced. The recent petition includes a wide range of wild-caught and farmed shrimp in raw and value-added products. Only breaded shrimp is excluded. The petitioners seek dumping/subsidizing rates of 4.8-111.4% for Ecuador and 4.85-37.36% for Indonesia. No specific rates are mentioned for the other countries.
The investigation started on 14 November 2023. Akin Gump expects it to take until 9 December 2024 before orders for anti-dumping and countervailing duties are issued.
China
Source: Chinese Customs
Note: contrary to the text below, the numbers in this graph exclude India’s exports to Vietnam which earlier may have partly been shipped to China through Vietnam-China border trade.
Source: Chinese Customs
In six years’ time, India’s shrimp exports to China (combined with Vietnam to capture the border trade between Vietnam and China) grew exponentially from 59,724 MT in 2014 to 191,571 MT in 2019. 2020 saw a drop to 132,036 MT, but exports in 2021 and 2022 slowly increased back to the level of 2019. Around 94% of India’s exports to China is accounted for by raw L. vannamei, 4% by wild-caught Asian pink shrimp, and 2% by P. monodon. In 2023, with 19% of total shrimp exports going there, China is India’s second biggest market. And, with a 24% market share, India is China’s second largest shrimp supplier.
Although Ecuador’s growth in China may appear to threaten India’s exports, the two countries actually supply different customers. The products that India sells to China mainly consist of HLSO bulk material destined for reprocessing in seafood processing clusters in China’s southern provinces. Based on China’s customs data, the importers of these products are primarily located in Guangdong and Zheijang, which have many of such large seafood processing clusters.
China’s imports from Ecuador come from importers throughout the country, though importers from northern provinces, with major population clusters Tianjin and Beijing, play a more critical role. Ecuador’s exports to China mainly consist of HOSO and HLSO products in finished packages destined for wholesale and retail markets. There aren’t many Indian companies that compete in this segment, with the exception of Abad Overseas, a joint venture between India’s Abad Group and Spain’s Nueva Pescanova. This company has developed infrastructure to produce, process, and export high-quality HOSO shrimp to Southern Europe, China, and other overseas markets for HOSO products.
Political tensions between the governments of China and India are perceived as a risk for shrimp trade between the two countries, as this can lead to non-tariff or tariff trade barriers being imposed.

EU 27
Source: Eurostat
Source: Eurostat
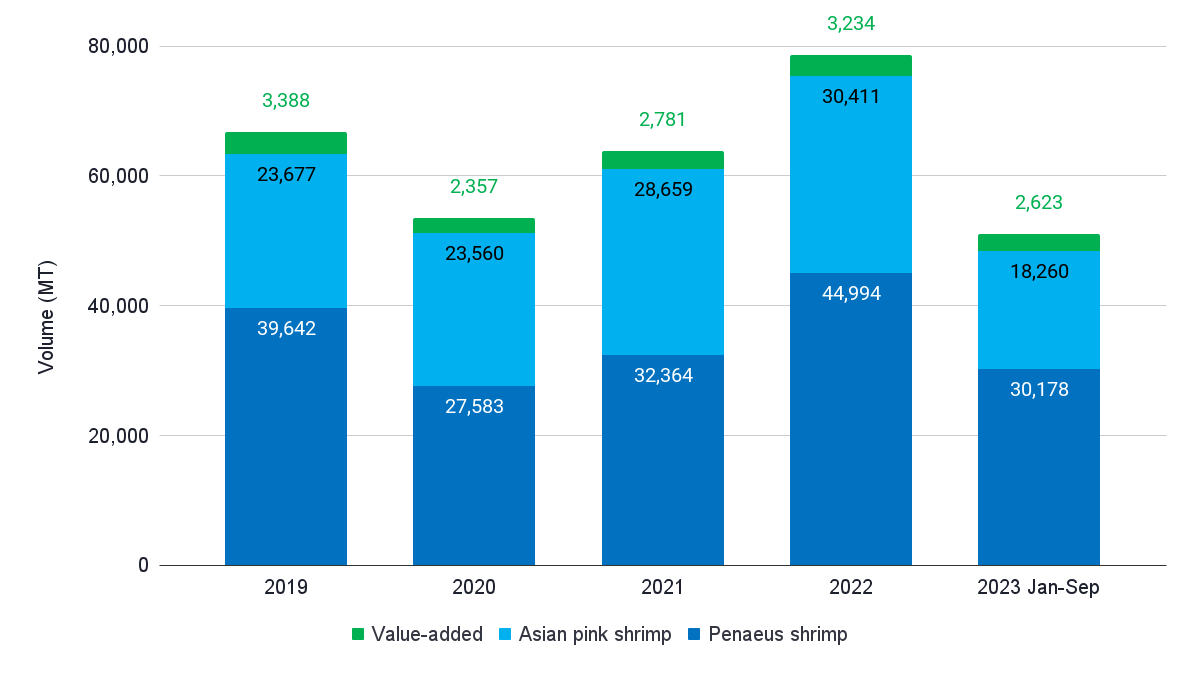
While under pressure from stringent EU food safety authority measures, India’s shrimp exports to the EU decreased from 67,695 MT in 2014 to 51,892 MT in 2020. The decline was entirely accounted for by a drop in raw L. vannamei exports from 44,538 MT in 2014 to 26,236 MT in 2020. More recently, however, EU imports from India have picked up again, increasing to 63,803 MT in 2021 and 78,640 MT in 2022. The EU never imported as much shrimp from India as in 2022.
EU import data shows that raw L. vannamei and P. monodon primarily drove the growth of imports, but imports of wild-caught Asian pink shrimp also increased (Figure 11). According to Indian export data, in 2022, the country’s exports to the EU consisted of 53% raw L. vannamei, 35% wild-caught shrimp, 8% raw P. monodon, and 4% cooked and breaded shrimp.
Raw Penaeus Shrimp
Taking a closer look at the EU’s import of Penaeus shrimp (in the EU, the customs code for Penaeus shrimp includes L. vannamei and P. monodon, both wild-caught and farmed), India’s market share dropped from around 24% in 2014 to 17% in 2020 and then climbed back to 21% in 2022. During this period, India has structurally been the EU’s second largest supplier of Penaeus shrimp, behind Ecuador, whose market share has grown to 44% in 2022. Other suppliers of raw Penaeus shrimp with smaller market shares include Vietnam (10%), Venezuela (8%), and Bangladesh (5%). While Vietnam’s market share has remained stable over the years, the market share of most other countries has declined.
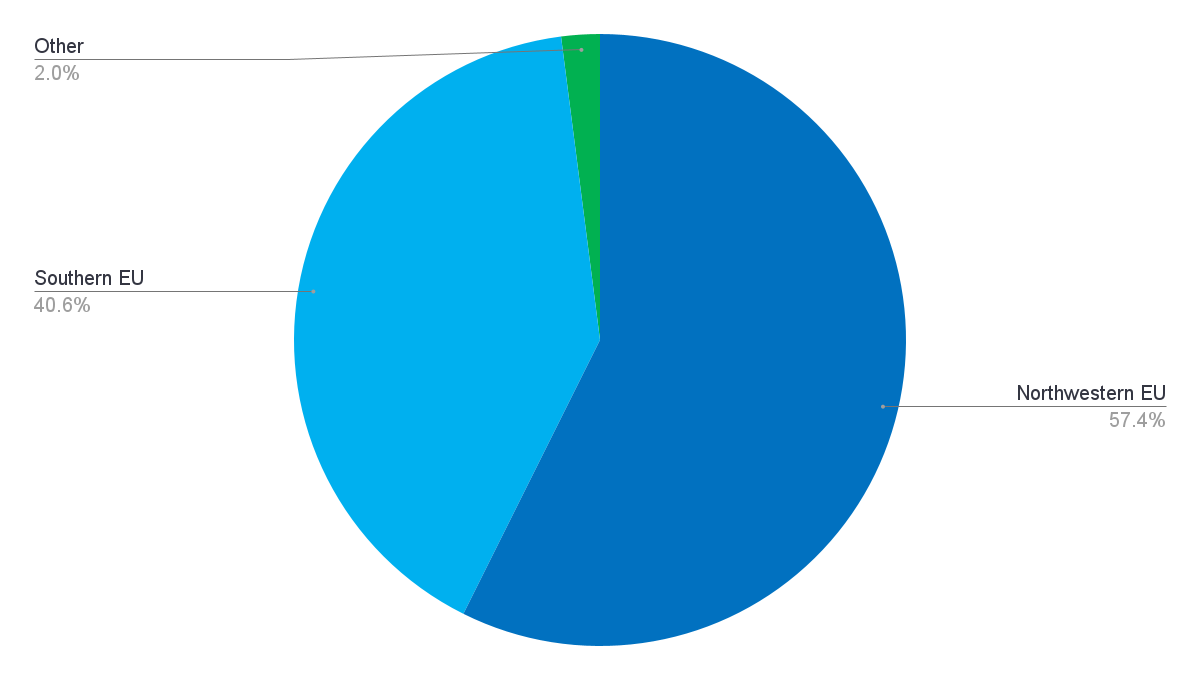
The EU can be divided into two main blocks: Southern EU (Cyprus, France, Greece, Italy, Portugal, and Spain) and Northwestern EU (Belgium, Denmark, Finland, Germany, Ireland, the Netherlands, and Sweden). The Southern EU is the largest consumer of Penaeus shrimp: France and Spain are the biggest markets, followed by Italy, Portugal, Greece, and Cyprus. Consumers in these countries primarily consume HOSO shrimp, which is why Ecuador and other Latin American countries dominate these markets. India controls the smaller peeled market in the Southern EU.
The Northwestern EU block is the second largest consumer of Penaeus shrimp: Belgium and the Netherlands are the biggest importers, followed by Germany and Ireland. Belgium and the Netherlands are the gateway to much of the European continent, as a lot of shrimp imported through these countries ends up in markets across the EU. Contrary to the Southern EU, the market in the Northwestern EU is primarily one for peeled shrimp. As a result, Asian suppliers, mainly India, have traditionally dominated it. India’s market share of the raw Penaeus segment in the Northwestern EU may be as high as 50%.
Although L. vannamei dominates the Northwestern EU market, P. monodon shouldn’t be overlooked. While Bangladesh previously controlled the market for P. monodon, nowadays, Vietnam and India also supply to these markets and their market shares are growing.
Cooked-at-Origin and Breaded
The cooked-at-origin and breaded segments in the EU may be as large as 35,000-40,000 MT for Penaeus shrimp, though India has yet to play a major role here. Today, Vietnam dominates both segments with a market share of around 75%. With increased competition from Ecuador in the US market, Indian exporters must reinvent themselves and diversify their capabilities and markets. Having recently made investments in cooking lines and breading facilities, Indian exporters are aiming to gain market share in these segments in the EU over the next few years.

EU Measures Pose Challenges for India’s Exports
Following several audits that raised concerns about the use of antibiotics in Indian shrimp farms, the EU started implementing 20% testing for Indian shrimp in 2010, adding cost and risk for EU importers buying Indian shrimp. In 2016, the EU increased the testing requirement to 50% of shipments to be tested once they arrive at the EU port. Measures became even more stringent after another audit in 2019: Indian authorities had to test all the shipments to the EU before leaving the Indian port.
The most controversial measure taken by EU authorities was that, from 2019, Indian exporters who tested positive for antibiotics lost their EU approval number. And new factories wouldn’t get such a number at all. Until today, exporters who lost their EU approval number haven’t had the chance to reclaim it. Usually, after several negative tests, a company would be allowed to return to the regular import regime, making the EU’s measure particularly severe.
The Indian industry generally perceives the EU measures as unfair, as antibiotics problems also exist in other countries of origin. Looking at EU import alerts, these problems may even be more severe in other countries. The report of the last audit, which took place in September 2022, finds that the EU is largely satisfied with how Indian authorities have handled suggestions for ensuring that shrimp exported to the EU isn’t contaminated with antibiotic residues. However, whether the measures will be relaxed soon is still being determined.
Vietnam
Vietnam, unfortunately, doesn’t publish shrimp import volumes. We must therefore rely on India’s export data, which shows that it exported 45,000 MT to Vietnam in 2022. This makes Vietnam India’s fourth largest market. Based on data from other suppliers to Vietnam—such as Ecuador (25%) and Argentina (4%)—India’s share would amount to around 60% of Vietnam’s total imports. Although some of the exports to Vietnam may be re-exported to China, most of Vietnam’s imports are used as raw materials for producing value-added products. These products are then re-exported to markets around the world. India’s exports to Vietnam in 2022 consisted of 92% raw L. vannamei and 5% raw P. monodon. The remainder is a mix of raw wild-caught species.
Japan
Over the past decade, Japan’s imports of Indian shrimp have remained relatively stable at around 200,000 MT. The country has always been India’s fourth or fifth largest shrimp market, and India has steadfastly been Japan’s second or third largest shrimp supplier. In 2022, India had a 17% market share, equal to Indonesia. With 24%, only Vietnam’s market share was bigger. In 2022, raw L. vannamei accounted for only 55% of India’s exports to Japan, raw wild-caught shrimp accounted for 31%, and raw P. monodon constituted 14% of India’s total exports to Japan.
Middle East and Africa
As its sixth market, the Middle East and Africa have always been essential for India. In 2022, India’s export volume to the Middle East and Africa amounted to 37,000 MT—a market share of around 40-45% in this region, which in 2022 imported around 85,000 MT of shrimp in total. The largest markets within the region are the United Arab Emirates (57% of India’s exports), Kuwait (15%), Mauritius (5%), and Saudi Arabia (5%). Exports to the Middle East and Africa in 2022 consisted primarily of raw L. vannamei (62%), wild-caught shrimp (32%), and raw P. monodon (4%).

Canada
Although Canada is a relatively small market, its shrimp imports increased from 51,498 MT in 2014 to 68,001 MT in 2022. Canada is India’s seventh market, and India is also Canada’s largest supplier. In 2022, India had a 31% market share, followed by Vietnam (25%), China (15%), and Thailand and Ecuador (each 8%). Ecuador’s market share is tiny, but its exports are growing faster than India’s. India’s exports to Canada in 2022 consisted of 70% raw frozen L. vannamei, 26% cooked and breaded L. vannamei, and 4% raw P. monodon.
Russia
Since 2015, Russia’s imports have steadily increased and are now back to their peak level of 2007. In 2022, Russia was India’s eighth market, in which year the country imported 66,107 MT shrimp. While China’s supplies to Russia came down from a peak of 15,452 MT in 2010 to 3,769 MT in 2022, imports from Argentina, Ecuador, India, and Vietnam all increased. In 2022, Ecuador supplied 25,411 MT and India supplied 17,424 MT, followed by Argentina (7,339 MT), and Vietnam (6,117 MT). Almost all of India’s exports to Russia (94% in 2022) consist of raw L. vannamei; cooked products account for the remainder.
The UK
During the past ten years, the UK’s shrimp imports have been stable, with a volume between 11,000 and 15,000 MT since 2014. In 2022, the UK imported 76,523 MT of shrimp, making it India’s ninth market. In 2022, exports amounted to 13,622 MT, consisting of almost 90% of raw L. vannamei. The remainder is a mix of cooked and breaded (4%), wild-caught (5%), and P. monodon (1%). India was the largest supplier of shrimp to the UK until 2017, after which it was overtaken by Vietnam. Since 2020, Ecuador’s exports to the UK have grown fast and compete for market share with Vietnam and India. In 2022, Vietnam had a market share of 25%, followed by India (18%) and Ecuador (10%). The UK imports a relatively large amount of coldwater shrimp, which in 2022 had a 25% market share.
Competing for the Raw, Cooked Peeled, and Breaded Markets
Although India has, over the past decade, dominated markets for raw HLSO and especially peeled shrimp, it’s been confronted with stiff competition in those markets since the rise of Ecuador. While Ecuador is gaining market share in most markets, it will not necessarily overtake India in all places. For example, Ecuador’s exporters will struggle to compete for program business in the US with India’s established suppliers.
India’s leading exporters to the US have established strong ties with US retailers and food service companies with whom they’ve been doing program business for many years and for whom they produce to their exact specifications. These clients are unlikely to switch suppliers overnight as they need dependability to guarantee the quality and availability of products. Building such relationships isn’t easy and takes time. Moreover, Indian processors have access to more affordable labor resources than Ecuador, and it’s unclear how competitive Ecuador is in the peeled shrimp segment. Even if some buyers do switch to Ecuador due to lower pricing, they’re unlikely to drop India and other Asian suppliers entirely as it would make them vulnerable.
While India may continue to lose market share to Ecuador in some markets, it also has market share to gain from other suppliers in these same markets. This is, for example, the case in the cooked and breaded segments where Indian suppliers, if capacity is developed, should be able to compete with suppliers from Indonesia, Thailand, and Vietnam. With many factories investing in cooking lines and several breading facilities having recently been constructed, as well as the need for India’s exporters to diversify their presence to other segments, it’ll be a matter of time before we’ll see exports of cooked and breaded shrimp more prominently in trade data.