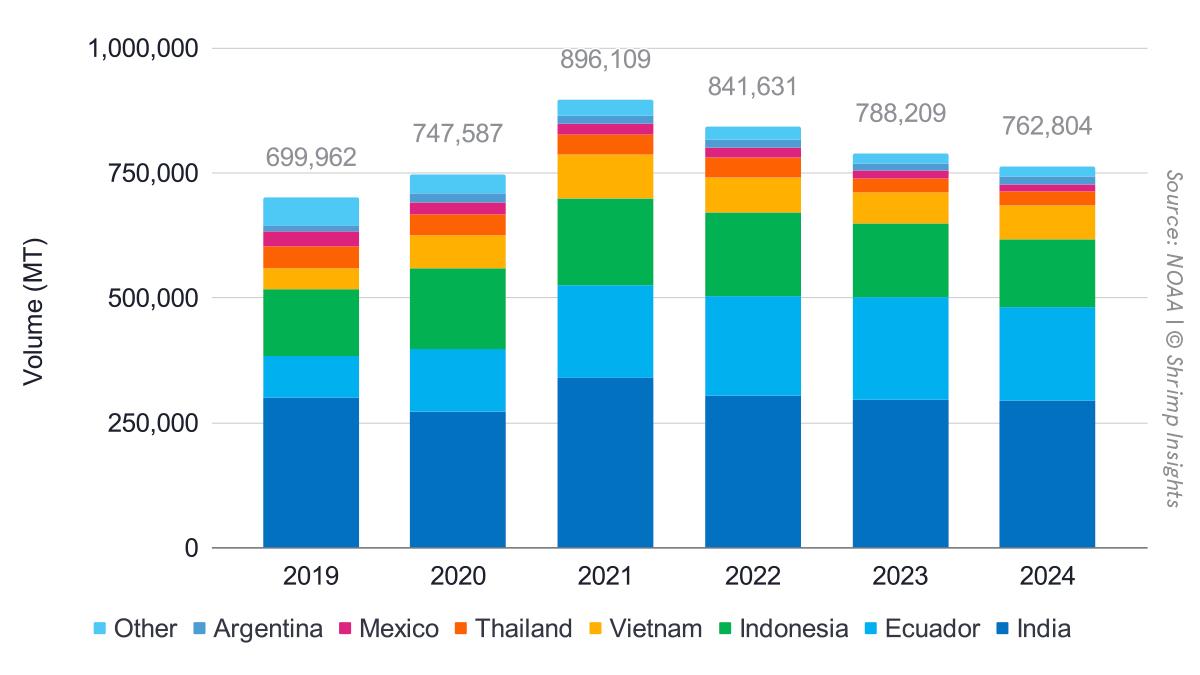
In 2024, the US imported 762,804 MT, 3% down from 2023 and 15% down from the peak of 2021. However, it’s still 9% above and confirms Angel Rubio’s statements that if we ignore the surge of imports due to market dynamics during COVID-19, the US is not far from where it should be if it would have followed the long-term growth curve. It must be acknowledged that while the volume is still ahead of pre-COVID times, the value of imports is only at par at $6 billion, which is in line with the low prices shrimp sales have experienced. Some more details of US imports are below:
- Total:
- December 2024: 66,650 = +2% YoY
- Q1 2024: 213,131 MT = 0%
- Year-total 2024: 762,804 MT = -3% YoY and +9% to 2019
- Suppliers
- India:
- December 2024: 23,714 MT = +4% YoY
- Q4 2024: 81,273 MT = +1% YoY
- Year-total 2024: 294,333 MT = -1% YoY and -2% to 2019
- Ecuador
- December 2024: 16,491 MT = -6% YoY
- Q4 2024: 44,347 MT = -14% YoY
- Year-total 2024: 187,040 MT = -9% YoY and +125% to 2019
- Indonesia
- December 2024: 12,717 MT = -3% YoY
- Q4 2024: 40,466 MT = +3% YoY
- Year-total 2024: 134,803 MT = -8% YoY and +1% to 2019
- Vietnam
- December 2024: 5,827 MT = +18% YoY
- Q4 2024: 21,695 MT = +23% YoY
- Year-total 2024: 69,295 MT = +13% YoY and +63% to 2019
- Thailand
- December 2024: 3,173 MT = +38% YoY
- Q4 2024: 11,155 MT = +16% YoY
- Year-total 2024: 28,154 MT = -3% YoY and -35% to 2019
- India:
- Products
- Peeled:
- December 2024: 30,990 MT = +4%
- Q4 2024: 101,660 MT = +3%
- Year-total 2024: 377,719 MT = +1% YoY and +24% to 2019
- Shell-on
- December 2024: 17,557 MT = -9%
- Q4 2024: 55,118 MT = -11%
- Year-total 2024: 203,552 MT = -12% YoY and -17% to 2019
- Cooked and marinated
- December 2024: 11,245 MT = +10%
- Q4 2024: 36,993 MT = +14%
- Year-total 2024: 115,121 MT = -3% YoY and +24% to 2019
- Breaded
- December 2024: 6,319 MT = +10%
- Q4 2024: 18,008 MT = -1%
- Year-total 2024: 60,772 MT = +1% YoY and +20% to 2019
- Peeled:
From the details above, it is very clear that while India in 2023 and 2024 has managed to limit its drop in export volume to the US and Ecuador’s exports dropped from 2023 to 2024, looking at the trend since 2019, Ecuador is still by far the US’s fastest-growing shrimp supplier. Supply to the US is consolidating, and India and Ecuador's combined market share has grown from 55% in 2019 to 63% in 2024.
Looking at the market shares of the different product categories in more detail, we can see that a drop in shell-on shrimp mainly accounted for Ecuador’s drop in exports. Ecuador’s supplies in this category dropped 17% year over year. While India’s supplies of shell-on shrimp also declined (13% year over year), Indonesia’s supplies remained flat, and Vietnam slightly increased (5% year over year). Ecuador continues to dominate this market segment with a 48% share.
In the peeled category, this scenario is slightly different. Ecuador’s and India’s supplies slightly increased (2% each), Indonesia’s supplies dropped by 15%, and Vietnam’s supplies increased by 21%. India continues to dominate this market segment with a market share of 57%.
India also dominates the cooked and marinated segment with a 40% market share. Indonesia’s supplies dropped by 16% in this segment, while Vietnam’s supplies were flat. Vietnam is encroaching on Indonesia’s second position and, if this trend continues, may take over from Indonesia in 2025. Ecuador’s market share remains small (4%), but its supplies grew 20% yearly.
While Indonesia is still the US’s largest supplier of breaded shrimp in 2024, with a market share of 42%, Vietnam is also encroaching on Indonesia quickly in this segment. While Vietnam’s exports of breaded shrimp surged 33%, Indonesia’s supplies only increased by 5%. With Vietnam now having a 28% market share, the two countries hold 70% of the market. India’s supplies more than doubled but still represent a market share of only 4%. Ecuador’s supplies dropped 20% year over year and now represent a 7% market share.