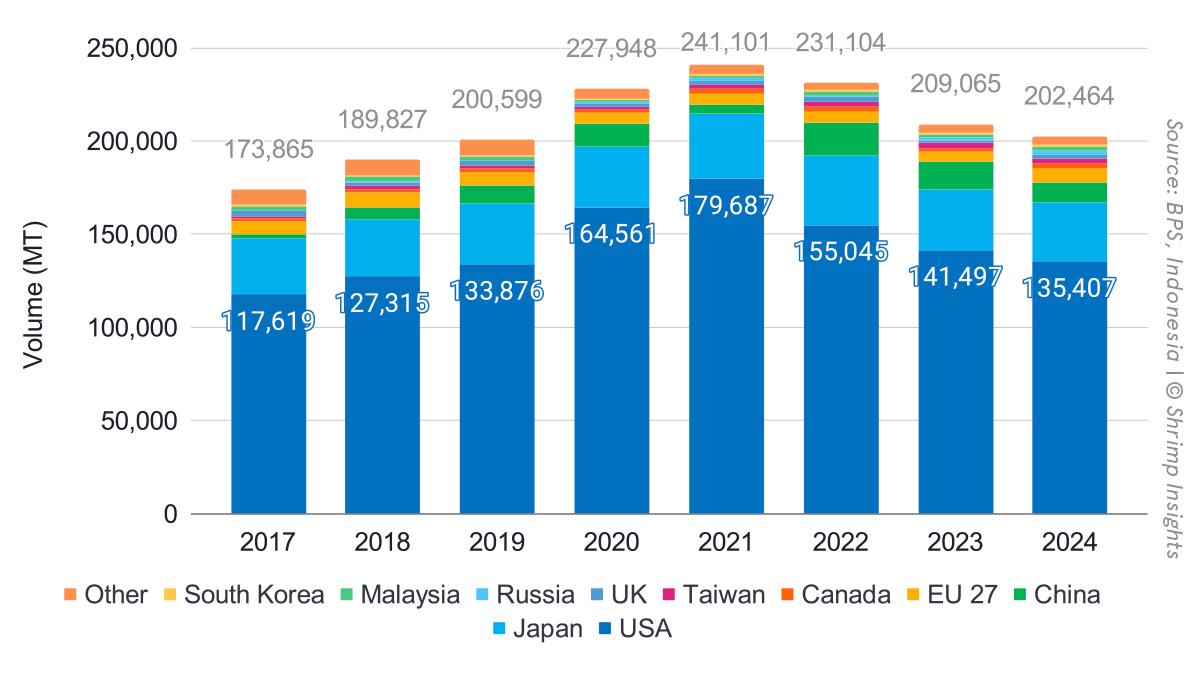
Indonesia’s shrimp exports have dropped for the third year in a row and went from its peak of 241,101 MT in 2021 to 202,464 MT in 2024. The total export value fell from a peak of $2.2 bln in 2021 to $1.6 billion in 2024. The average value per kilogram dropped from a record of $9.07 in 2022 to $7.96 in 2023 to $7.93 in 2024. Important to mention is that considering the year-total drop in exports, the decline was realized in the first half of the year. In the second half exports slightly increased YoY. Some more details are below.
- Total:
- December 2024: 18,091 MT = +13% YoY
- Q4 2024: 56,656 MT = +5% YoY
- Year-total 2024: 202,464 MT = -3% YoY and +1% to 2019
- Top Five Markets:
- US:
- December 2024: 12,079 MT = +11% YoY
- Q4 2024: 37,516 MT = +1% YoY
- Year-total 2024: 135,407 MT = -4% YoY and +1% to 2019
- Japan
- December 2024: 2,589 MT = -2% YoY
- Q4 2024: 8,082 MT = -3% YoY
- Year-total 2024: 31,575 MT = -2% YoY and -3% to 2019
- China
- December 2024: 684 MT = +100% YoY
- Q4 2024: 3,825 MT = +52% YoY
- Year-total 2024: 10,834 MT = -29% YoY and +9% to 2019
- EU
- December 2024: 880 MT = +42% YoY
- Q4 2024: 2,104 MT = +31% YoY
- Year-total 2024: 7,437 MT = +39% YoY and +10% to 2019
- Canada
- December 2024: 297 MT = +44% YoY
- Q4 2024: 957 MT = +108% YoY
- Year-total 2024: 2,878 MT = +62% YoY and +46% to 2019
- US:
- Products:
- Raw L. vannamei
- December 2024: 9,139 MT = +19% YoY
- Q4 2024: 28,153 MT = +10% YoY
- Year-total 2024: 95,613 MT = -5% YoY and -9% to 2019
- Raw P. monodon
- December 2024: 863 MT = +17% YoY
- Q4 2024: 2,579 MT = -6% YoY
- Year-total 2024: 10,254 MT = -4% YoY and -58% to 2019
- Raw other shrimp
- December 2024: 2,030 MT = +13% YoY
- Q4 2024: 7,735 MT = +14% YoY
- Year-total 2024: 29,752 MT = +4% YoY and +51% YoY
- Value-added
- December 2024: 6,058 MT = +3% YoY
- Q4 2024: 18,189 MT = -4% YoY
- Year-total 2024: 66,845 MT = -3% YoY and +30% YoY
- Raw L. vannamei
The data on Indonesia’s top five export markets shows that although the US is losing ground compared to the peak of exports in 2022, it’s still responsible for most of Indonesia’s exports and importing slightly more than before COVID-19. Nevertheless, with the imposition of duties, Indonesia will face an uphill battle in the US as prices remain low and margins have decreased. It’s unclear how this will affect 2024 exports to the US, but it is not unlikely that exports will drop further, and Indonesia will have to work hard to diversify its markets.
Japan and China seem unable to absorb more of Indonesia’s shrimp, at least not in 2024. However, other markets, such as the EU, have shown short- and long-term growth potential. However, Indonesia is also facing challenges in the EU. The country is, for example, currently not yet listed on the new EU-approved third country list (depending on whether policies to prevent the use of antibiotics in the production of animal protein products for exports to the EU are in place). The Indonesian government must take quick and substantial steps to ensure that Indonesia’s aquaculture products will not lose access to the EU market.
Other markets that show short- and long-term growth potential include Canada, Russia, and South Korea. However, it will take time for these markets to take a substantial share of Indonesia’s exports. For the foreseeable future, Indonesia’s industry will remain largely dependent on its ability to compete in the US market despite the tariffs that make Indonesia’s shrimp more expensive than some of its competitors.