US Shrimp Imports Per Category from 2019 till 2023
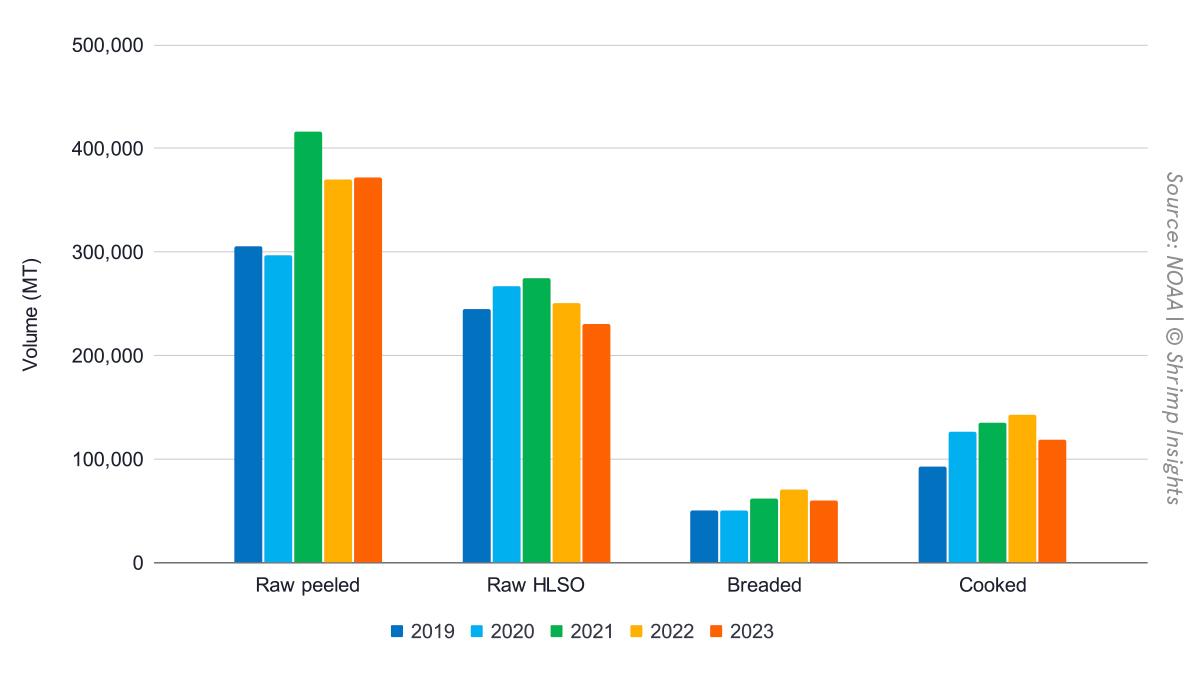
US Shrimp Imports in 2023 are down by 6% compared to 2022, but a closer look at the main product categories reveals a mixed picture. Amidst slow demand, while these categories experienced positive growth in previous years, in 2023, the imports of cooked and breaded products dropped hard by 17% and 15%, respectively. Imports of raw HLSO shrimp dropped by 8%, a continuation of the negative trend in 2022. On the contrary, imports of raw frozen peeled shrimp, with 1% year-on-year growth, did not drop further.
Supply dynamics vary per category.
- Raw peeled: India and Indonesia did not lose more market share. The US increased its imports from India and Indonesia by 4% and 3%, respectively. Ecuador, after years of continuous growth, with a 1% drop, did not grow its exports of raw peeled shrimp to the US further and lost some market share in this product category. With a 56% market share, India remains the largest supplier of raw peeled shrimp. It is followed by Ecuador (21%), Indonesia (13%), and Vietnam (5%).
- Raw HLSO: Ecuador continued its positive trend from previous years. The US increased imports from the country by 8%. US importers dropped imports from Indonesia and India in this category by 24% and 17% respectively. For the first time, Ecuador holds a majority market share of 51% in this category. Indonesia’s and India’s market shares dropped to 18% and 16%, respectively.
- Cooked: The 17% drop in imports of cooked shrimp was equally accounted for by the four largest suppliers. US imports from India dropped by 15%, while imports from Indonesia and Vietnam dropped by 18% and imports from Thailand by 35%. Imports from Ecuador, though still small, increased by 73%. India has grown its market share to 41%, Indonesia maintains a 27% market share, and Vietnam has a 21% market share. Thailand’s market share dropped to 7%, while Ecuador’s market share grew to 3%.
- Breaded: All significant suppliers of breaded shrimp saw US imports drop. Vietnam and Ecuador saw the most substantial drops at 22% and 32%, respectively. Indonesia and Thailand saw their imports drop by 9% and 10%, respectively. Indonesia has grown its market share to 40%. Vietnam and Thailand hold a 22% and 21% market share, respectively. Ecuador saw its market share drop to 8%. China’s market share further dropped to 6%.
More trade statistics and analysis in the 2023 full-year trade data review which will be published by the end of this month.
Sponsored by