After a 20% year-over-year increase in January, February recorded an 8% year-over-year growth. The YTD is now at 135,556 MT, 14% more than in 2024 and only 6% less than in record year 2022. India (+27%), Indonesia (+3%), and Vietnam (+18%) are all ahead year-over-year, while Ecuador, despite 4% year-over-year growth in February, is still behind 4% year-over-year. The most substantial growth is recorded for peeled (+22%) and cooked and marinated (+35%) shrimp. Imports of shell-on products are still behind.
Total:
- Value:
- January 2025: 604.0 mln USD = +31%
- February 2025: 530.9 mln USD = +16%
- YTD (Jan–Feb): 1,134.9 mln USD = +24%
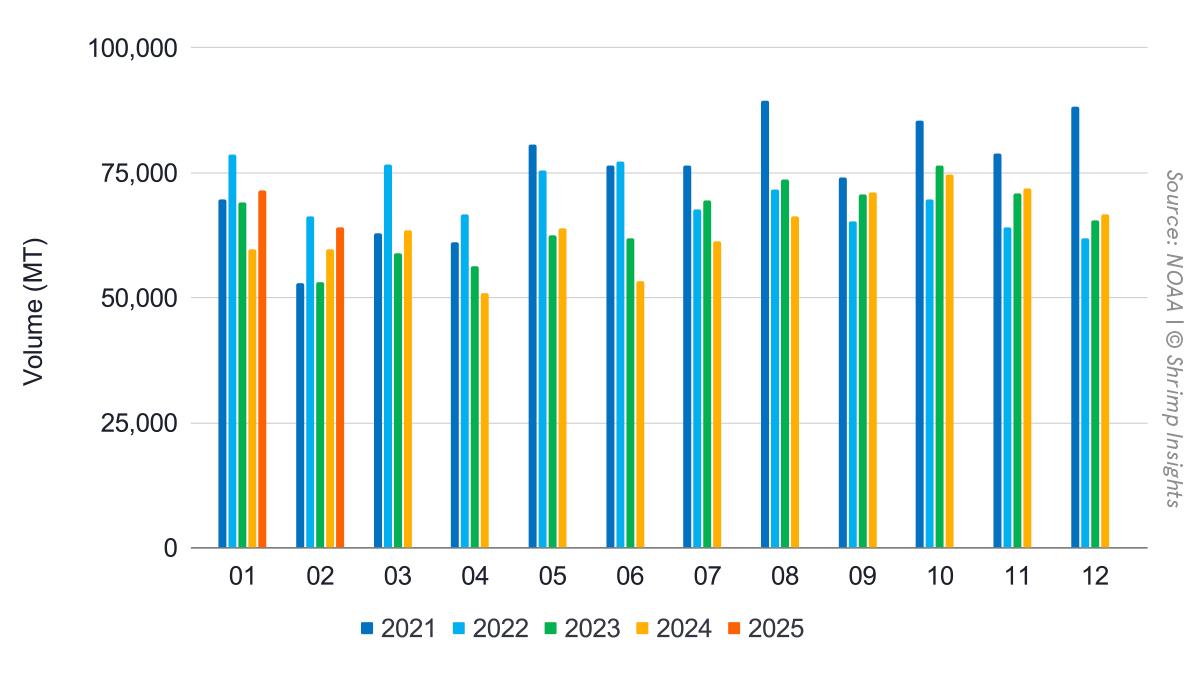
- Volume:
- January 2025: 71,412 MT = +20%
- February 2025: 64,145 MT = +8%
- YTD (Jan–Feb): 135,556 MT = +14%
Suppliers:
- India
- January 2025: 31,165 MT = +55%
- February 2025: 24,641 MT = +4%
- YTD (Jan–Feb): 55,806 MT = +27%
- Ecuador
- January 2025: 15,301 MT = -13%
- February 2025: 17,804 MT = +5%
- YTD (Jan–Feb): 33,105 MT = -4%
- Indonesia
- January 2025: 11,534 MT = +1%
- February 2025: 10,469 MT = +5%
- YTD (Jan–Feb): 22,003 MT = +3%
- Vietnam
- January 2025: 4,963 MT = +35%
- February 2025: 3,690 MT = +1%
- YTD (Jan–Feb): 8,653 MT = +18%
Products:
- Peeled Frozen
- January 2025: 35,949 MT = +39%
- February 2025: 32,175 MT = +8%
- YTD (Jan–Feb): 68,124 MT = +22%
- Shell-On Frozen
- January 2025: 18,068 MT = -9%
- February 2025: 16,793 MT = -3%
- YTD (Jan–Feb): 34,861 MT = -6%
- Value-Added (Cooked/Marinated)
- January 2025: 11,757 MT = +42%
- February 2025: 9,776 MT = +27%
- YTD (Jan–Feb): 21,534 MT = +35%
- Value-Added (Breaded)
- January 2025: 5,078 MT = +0%
- February 2025: 4,768 MT = +10%
- YTD (Jan–Feb): 9,845 MT = +5%
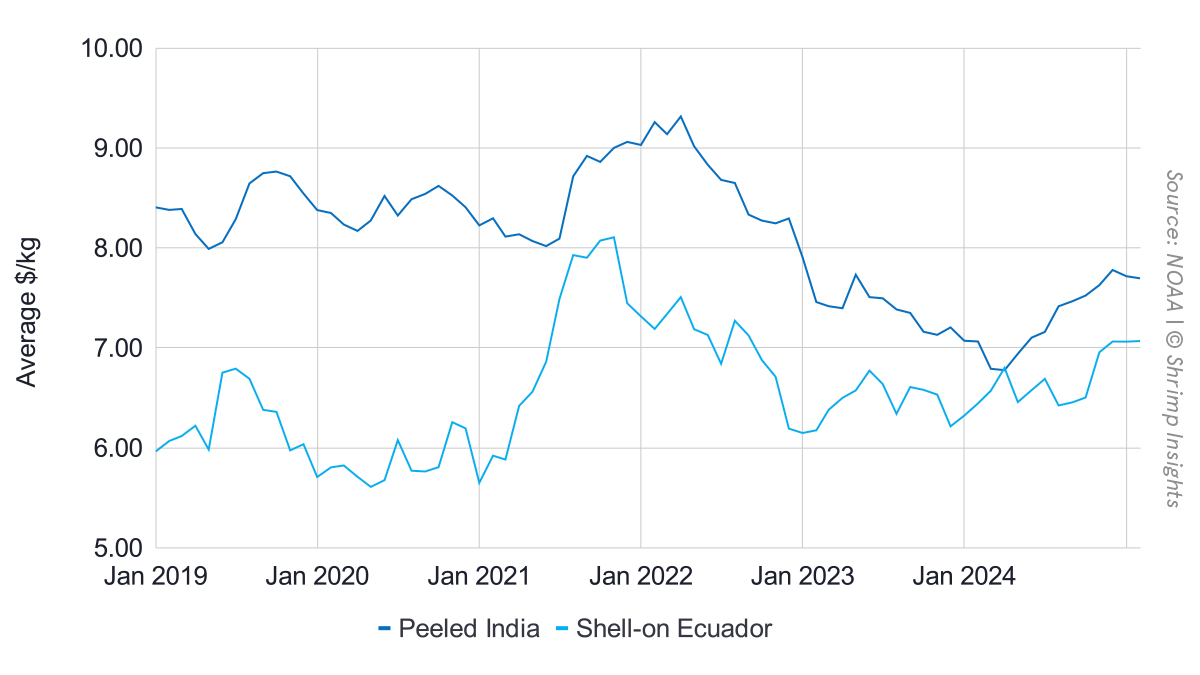
The value of imports increased by 24% year over year but is behind 18% compared to the record in 2022, signaling that the average value of imports per kg has improved drastically year over year but is still considerably below the level of the second half of 2021 and early 2022 before the fall in import value started.