In this second short October blog – read the first again here – I want to share data disclosed by the Vietnamese Association of Seafood Exporters and Processors (VASEP). Every quarter, VASEP releases a report with detailed export data. VASEP reports export values (not volumes) per species based on the 6-digit HS code, allowing us to see different trends in the exports of L. vannamei, P. monodon, and wild-caught shrimp. On my request, VASEP also included export data per species for the top Vietnamese exporters. As VASEP’s latest report only covers January till June 2021, with this blog I don’t aim to discuss the latest situation in Vietnam. Rather, I plan to give you an in-depth insight into the different export markets and producers for L. vannamei and P. monodon shrimp.
The Shrimp blog is sponsored by Grobest, Inve Aquaculture, DSM Animal Nutrition, American Penaeid Inc., Zeigler Nutrition, Aqua Pharma Group, Mega Supply, and Undercurrent News.
VASEP sells quarterly seafood trade data reports that are much more detailed compared to other sources. These reports only cost around $100 and I would recommend everyone following Vietnam’s performance to subscribe to VASEP’s publications.
Value of L. Vannamei Exports Reached $1.3 Billion Equally Driven by Exports of Raw Frozen and Value-Added Products
Comparing the period January till June 2020 with the same period in 2021 shows that the export value of Vietnam’s total shrimp exports increased from $1.5 to $1.8 billion. While the export value of P. monodon and wild-caught shrimp declined, the export value of L. vannamei increased from $1.1 to $1.3 billion (see Figure 1). The growth of the L. vannamei export value was equally accounted for by the exports of raw frozen and value-added L. vannamei products: both increased by about 20%. The value of the L. vannamei exports’ share in total exports increased from 70% to 75%. Nevertheless, at a value of $266 million, Vietnam also remains the world’s largest exporter of P. monodon. We’ll take a look at these two farmed shrimp species in more detail below.

Figure 1: Vietnam’s export value per species/per HS code from Jan.-June 2020 and Jan.-June 2021
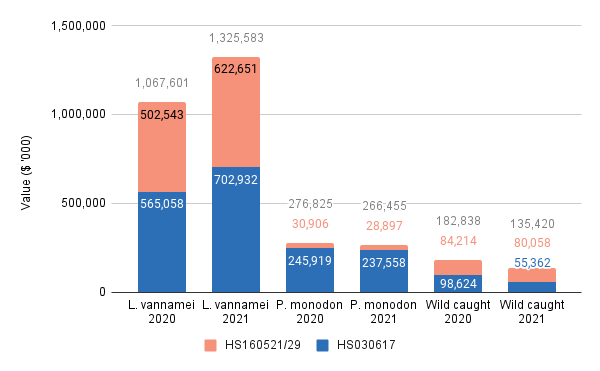
Source: VASEP
The US Consolidates as the Largest Market for Vietnam's L. Vannamei While Also Closing in on China and Japan for P. Monodon
Each product in Vietnam’s export basket has its own market. While overall the US, the EU, Japan, and China are the largest markets, for specific species and HS codes, the rankings can differ (see Figure 2).
The US is clearly the largest market for value-added L. vannamei products. NOAA’s US import data reveals that the US's imports of value-added shrimp are, to a large extent, accounted for by breaded shrimp. This means that in terms of exports of cooked and peeled shrimp, which are captured under the same HS codes, the EU is actually more important for Vietnam than it seems to be when looking at the data depicted in Figure 2 alone.

Also interesting is that when looking at the exports of raw frozen P. monodon, China turns out to be the biggest market. In reality, China might even be much more important for all species and HS codes as it is likely that a significant volume of shrimp is transported to China over land and goes unreported in VASEP’s numbers. That said, looking at the increase in market share of the US, it seems that US consumers have increased their appetite for P. monodon from Vietnam: imports increased from $17 million in 2020 to $34 million in 2021.
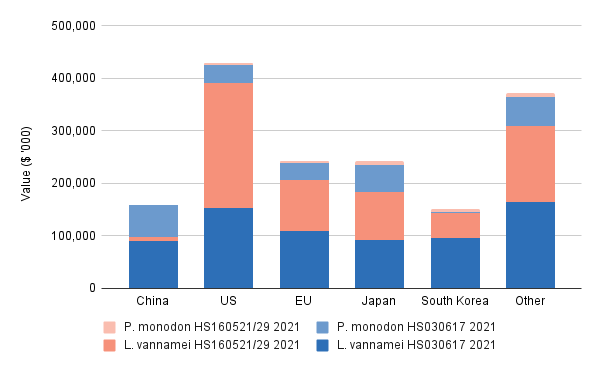
Figure 2: Comparison of market shares of the largest export destinations per species/per HS code
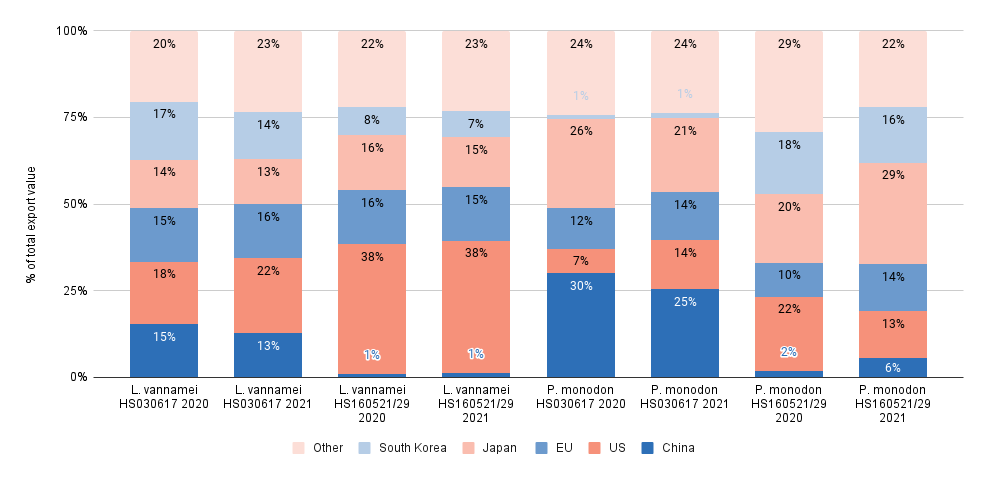
Source: VASEP
Instead of looking from a species and HS-code perspective, looking at each market and the product basket making up imports from Vietnam reveals interesting differences (see Figure 3). The US is the only market for which cooked and further value-added L. vannamei (160521/29) – not raw frozen L. vannamei (030617)– makes up most of the exports. For China, on the other hand, cooked and value-added products don’t play a role at all; all imports consist of raw frozen L. vannamei and P. monodon.
For me, it remains surprising that the EU is not more important as an export market for L. vannamei, given the EU-Vietnam Free Trade Agreement and the trouble of Indian exporters in the EU. Perhaps this can be explained – at least to a certain extent – by the increase of exports from South and Central America to the EU. South Korea is also worth mentioning: while Asian markets traditionally have a taste for P. monodon, South Korea doesn’t import much P. monodon from Vietnam but instead almost exclusively raw frozen (HS030617), and cooked and value-added L. vannamei (HS160521/29).

Figure 3: Comparison of product basket for the major export destinations
Source: VASEP
Minh Phu Seafood Corporation Dominates Vietnam’s Exports but More for P. Monodon than for L. Vannamei
VASEP always presents the top 10 exporters. The list for the first half of 2021 compared to 2020 is provided in Figure 4. Clearly, Minh Phu (reported by VASEP separately for the two main group companies) is by far Vietnam’s largest exporter. The combined export value of the two divisions amounted to $280 million, accounting for 17% of Vietnam’s total shrimp exports. Stapimex follows as a good second with an export value of around $150 million. With a big gap, Fimex, Vina Cleanfood, and Thuan Phuoc conclude the top 5, all having an export value of just above $50 million. Minh Phu and Fimex are listed on the Ho Chi Minh stock exchange, and you can follow their performance here: Minh Phu (MPC) and Fimex (FMC).
Figure 4: Vietnam’s top 10 exporters according to value in Jan.-June 2020 and Jan.-June 2021
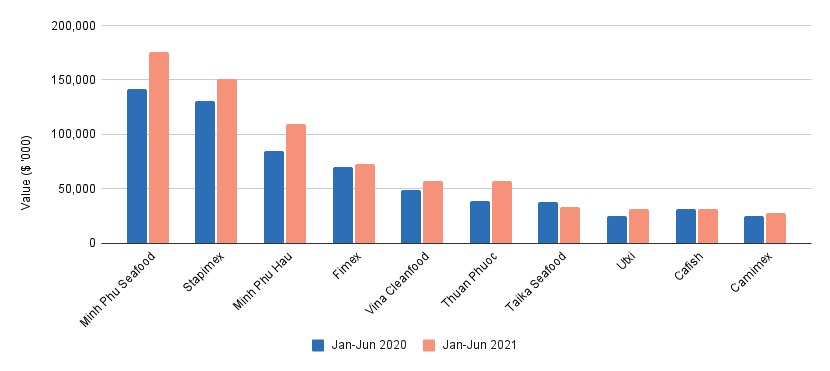
Source: VASEP
I asked VASEP whether they could also provide a top 20 of P. monodon exporters and L. vannamei exporters separately. Although the data VASEP provided is not completely aligned with the data provided for their usual top 10 overall shrimp exporters’ values, when translating it in relative shares to the total export value of the top 20 players, it results in the overview in Figure 5.

Figure 5: An estimation of the share per species in the top 10 exorters’ total export value
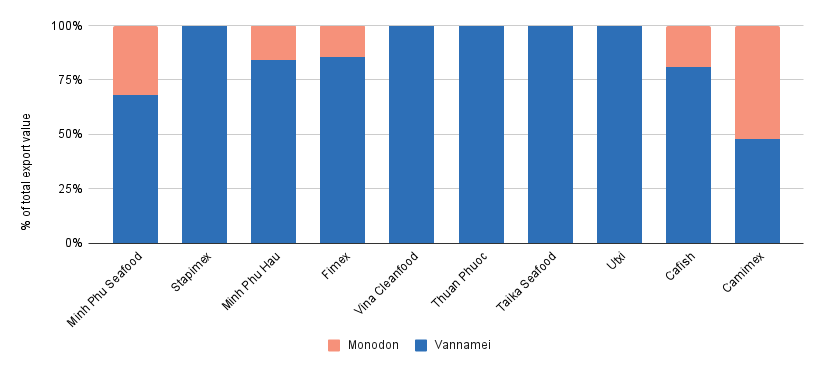
Source: VASEP
Note: This figure shows some companies whose exports consist of 100% L. vannamei, but in reality the companies could still do a fraction less than 5% of P. monodon – I can’t say this from VASEP’s data, because only the top 20 exporters per species were provided, and not the smaller exporters.
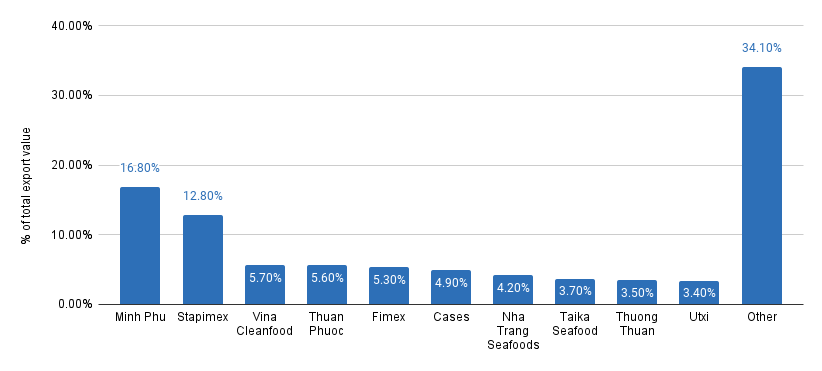
While Minh Phu is also dominant as an L. vannamei exporter, its dominance is much less prevalent than when looking at the total exports or at the P. monodon exports. Its 17% share of total L. vannamei exports (see Figure 6) keeps it much closer to Stapimex (which follows with a 13% market share) and the other top 5 L. vannamei exporters (which each have between 5%-6% of total exports).
Figure 6: The top 10 L. vannamei exporters in Jan.-June 2021 and an estimation of their market share of total L. vannamei exports
Source: VASEP
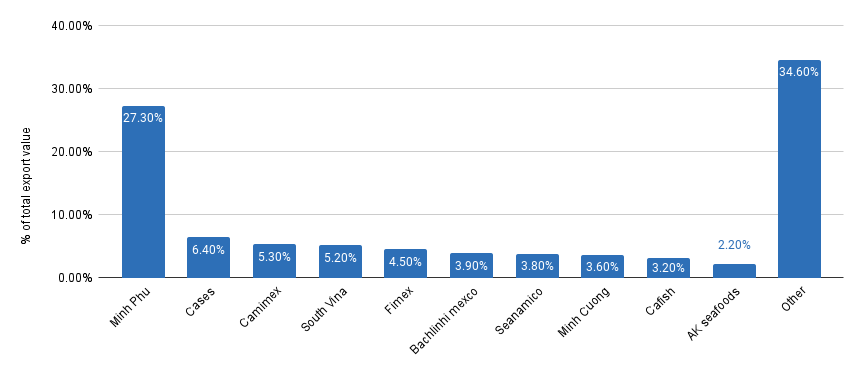
In P. monodon exports, Minh Phu’s dominance amounts to an almost 30% market share (Figure 7). Ca Mau-based exporters such as Cases, Camimex, and South Vina follow at around 5%-6% each. However, in terms of consolidation, both for L. vannamei as well as for P. monodon, the top 10 exporters of each species account for around 65% of total exports of the species. Looking at total shrimp exports (Figure 5), the top 10 exporters account for only 43% of total exports.
Figure 7: The top 10 P. monodon exporters in Jan.-June 2021 and an estimation of their market share of total P. monodon exports
Source: VASEP
In the Next Short Blog: Indonesia’s Latest Export Figures
In the next blog, I’ll try to give you a near real-time update of Indonesia's L. vannamei exports. Moreover, I’ll work together with Urner Barry Consulting’s Angel Rubio to identify the top 10 exporters of Indonesian shrimp to the US and the top 10 US importers of Indonesian shrimp. Stay tuned!