In this blog, I will briefly update shrimp imports from the world’s three largest markets: the US, China, and the EU. I will summarize 2023 imports and provide insights into the first months of 2024, as far as data is available. After reading this blog, you will better understand the longer-term import trends and the current market situation.
In 2024, the Shrimp Blog is supported by: Inve Aquaculture, Taprobane Seafoods, DSM-Firmenich, Zeigler Nutrition, Bioiberica, Megasupply, American Penaeid, Omarsa and eFishery.

Key takeaways
Overall
- Looking at the world’s four largest shrimp markets, in 2023, a drop of imports in the US, the EU, and Japan has been compensated for by an increase in imports in China. Shrimp imports (of HS 030617 and HS 1605) in the four countries combined from 2022 to 2023 were flat at just above 2.5 million MT.
- While the total volume imported in the world’s four largest markets remained flat, prices dropped, reflected in a drop in the value of imports by these four largest markets from $19.7 billion in 2022 to around 17.3 billion in 2023.
The USA
- In 2023, US imports of peeled shrimp were stable, while imports of Head-on, cooked, and breaded shrimp declined. In January and February 2024, supplies of cooked shrimp continued to decline year-on-year while all other categories were stable.
- In 2023 and the first few months of 2024, the supply of warm-water shrimp to the US steadily consolidates in India and Ecuador's hands. Most other suppliers are losing market share.
- The US’s imports in 2024 are not a good indicator of the actual market situation, as imports may be influenced by the expected anti-dumping and countervailing duty case rulings scheduled over the next few months.
China
- China’s shrimp imports in 2023 almost exceeded 1 million MT, and many people hope they will continue growing. However, this is highly uncertain, considering the current possible oversupply situation in the Chinese market.
- While China’s 2024 shrimp imports are ahead of 2023, imports in March 2024 are expected to show a significant year-on-year drop, bringing the year-on-year growth rate close to break-even.
- 2023’s growth of imports has come at the cost of continuously falling average import values from mid-2022 onwards. It’s yet unclear what will happen with the average import value post-Chinese New Year.
The EU
- After a few years of post-COVID growth, EU shrimp imports fell from 2022 to 2023. The first indication from import statistics of January 2024 and the sentiment from a range of EU buyers is that imports in 2024 will not fall much further.
- The Western EU region accounted for most of the fall in EU imports, but imports in the Southern EU region also slightly dropped. The more substantial drop in the Western EU’s imports comes with a significant drop in imports of value-added shrimp, mainly consumed in this region.
- A clear underlying trend shows that while Latin American suppliers continuously expand their market share in the EU, Asian suppliers lose market share. However, essential nuances exist within Latin America and Asia.

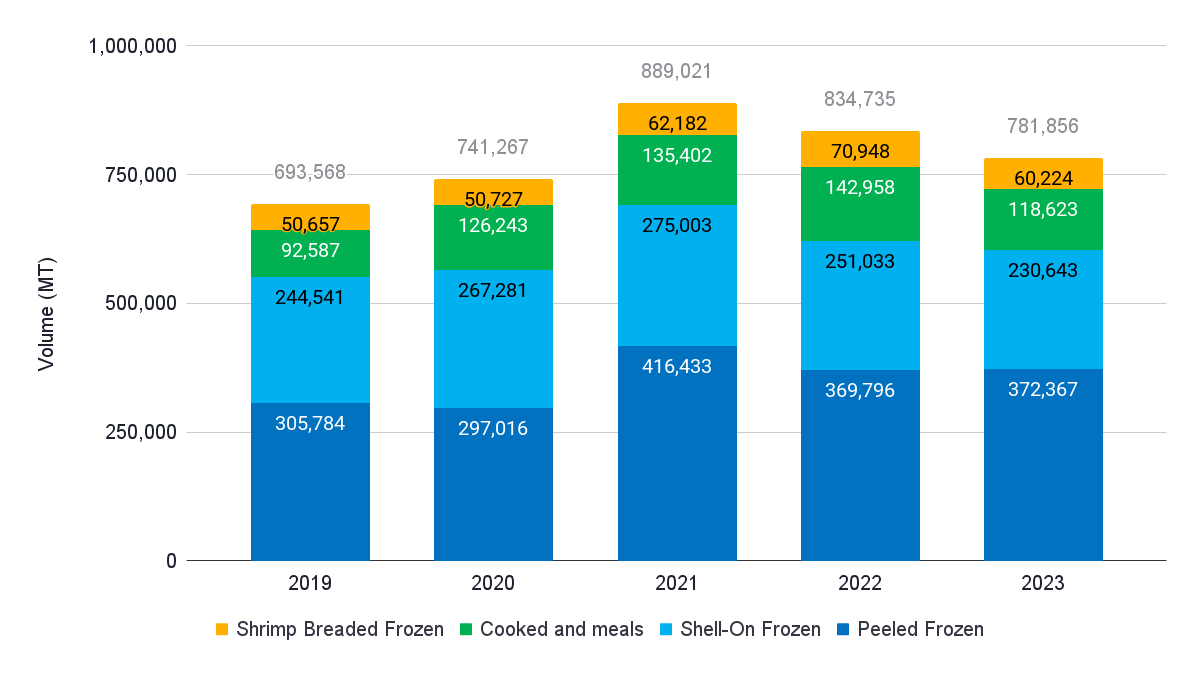
The USA
The US’s total imports of warm-water shrimp, calculated by the sum of HS codes for warm-water peeled, shell-on, cooked and meals, and value-added shrimp, reached 781,856 MT in 2023. This declines from 889,021 MT in 2021 and 834,735 MT in 2022. However, it is still well above the volumes of 2019 and 2020.
Source: NOAA
If we look at the key product categories, it’s clear that the imports of peeled shrimp, after falling deep from 2021 to 2022, stabilized in 2023. The imports of shell-on shrimp continued to decline from 2021 to 2022 to 2023. Surprisingly, the imports of cooked meals and breaded shrimp, while growing from 2021 to 2022, dropped from 2022 to 2023. In the first two months of 2024, only imports of cooked shrimp and meals drop further year-on-year. The imports of all other categories seem to have stabilized.
Source: NOAA
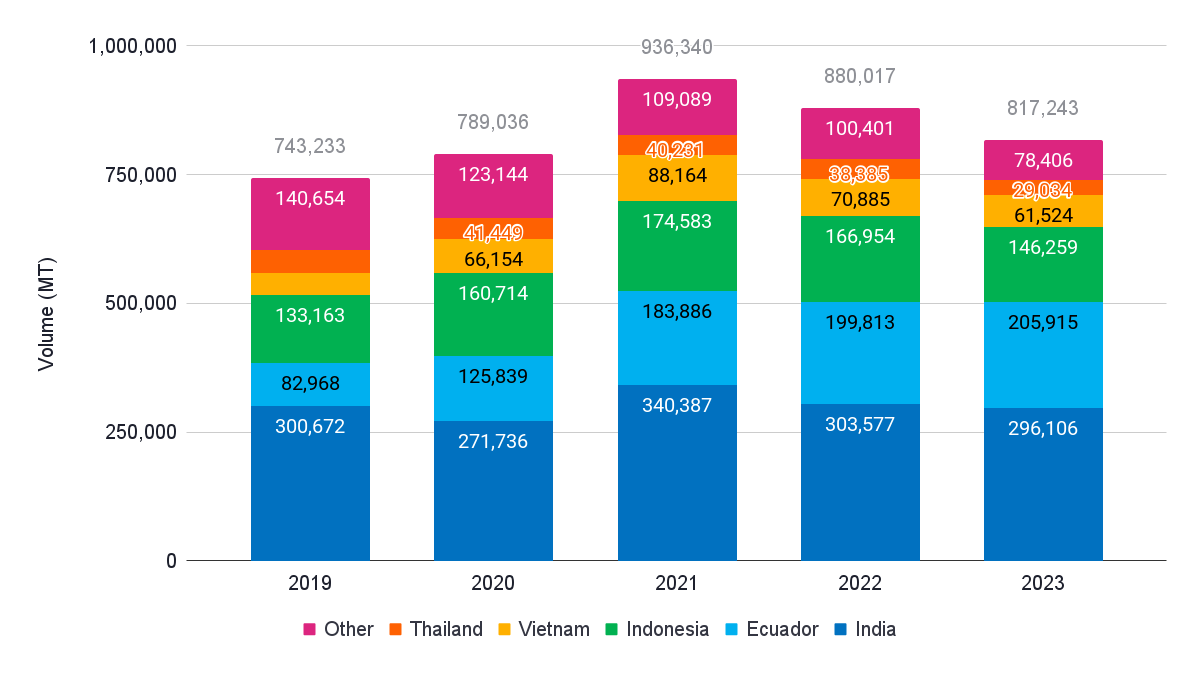
If we look at the suppliers of warm-water shrimp to the US market, it’s clear that Ecuador is the only country that continues to grow its market share. In 2023, it reached 28%, and in the first two months of 2024, it touched 30% for the first time. India’s market share fluctuated between 37% and 43% from 2019-2023; in the first two months of 2024, it reached 38%. Supply is increasingly consolidating into the hands of Ecuador and India. Their combined market share grew from 52% in 2019 to 67% in the first two months of 2024.
If we look at the following three biggest suppliers, Indonesia, Vietnam, and Thailand, each saw a slight drop in their market share. Indonesia went from a peak of 22% in 2022 to a low of 18% in the first two months of 2024. Vietnam went from a peak of 9% in 2021 to a low of 5% in 2023, and Thailand went from a peak of 6% in 2019 to a low of 3% in the first two months of 2024. If we add these three market shares to Ecuador and India's market shares, the combined grew from 84% in 2019 to 95% in the first two months of 2024.

Source: NOAA
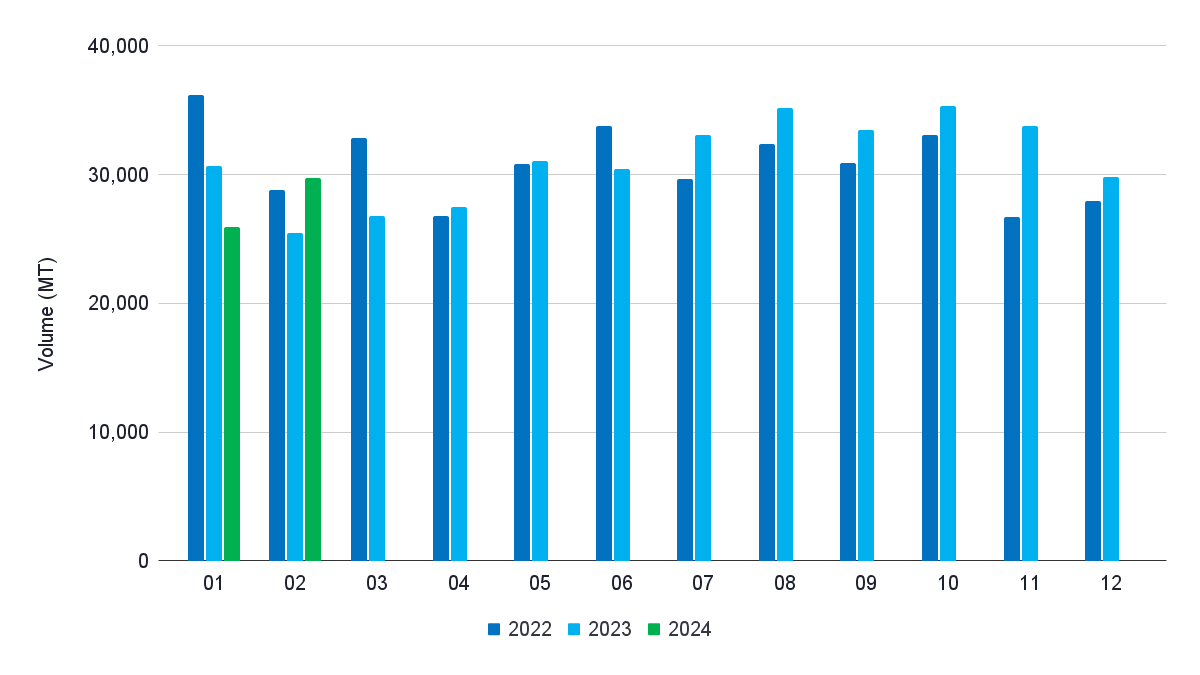
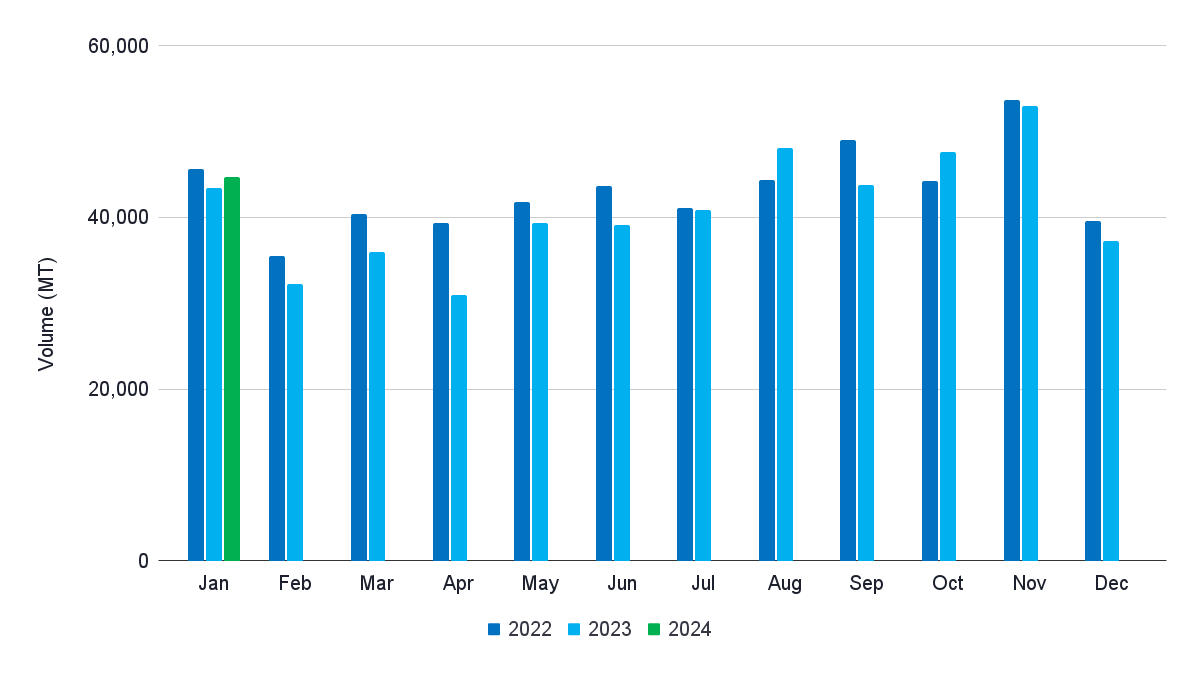
Over the first two months of 2024, the US imported 118,377 MT of shrimp. This is just 2% less than the same period 2023 but 18% less than in 2022. If this trend continues, 2023 may see a slight drop in imports compared to 2023. However, the scenario is unclear due to the unknown outcomes of the anti-dumping and countervailing duty cases, which may drastically change the scenario once final rulings are announced.
If we look at per-country supplies to the US, we can see that over the first two months of 2023, India is 1% down, Ecuador 2% up, Indonesia 13% down, and Vietnam 18% up. Even though the anti-dumping and countervailing duty cases may have influenced supplies to the US in these first months of 2023, it’s clear that Indonesia’s market position in the US continues to be under pressure. Despite Vietnam having recovered a bit compared to 2023, the supply to the US in 2024 will further consolidate into the hands of Ecuador and India.
Source: NOAA
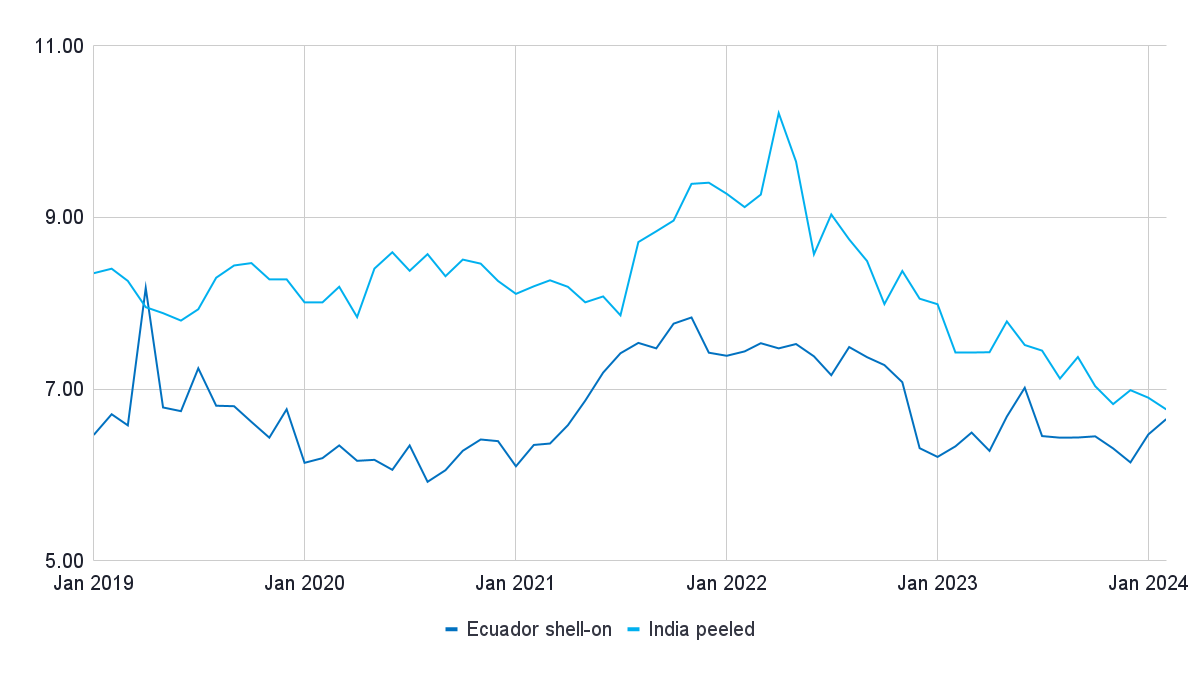
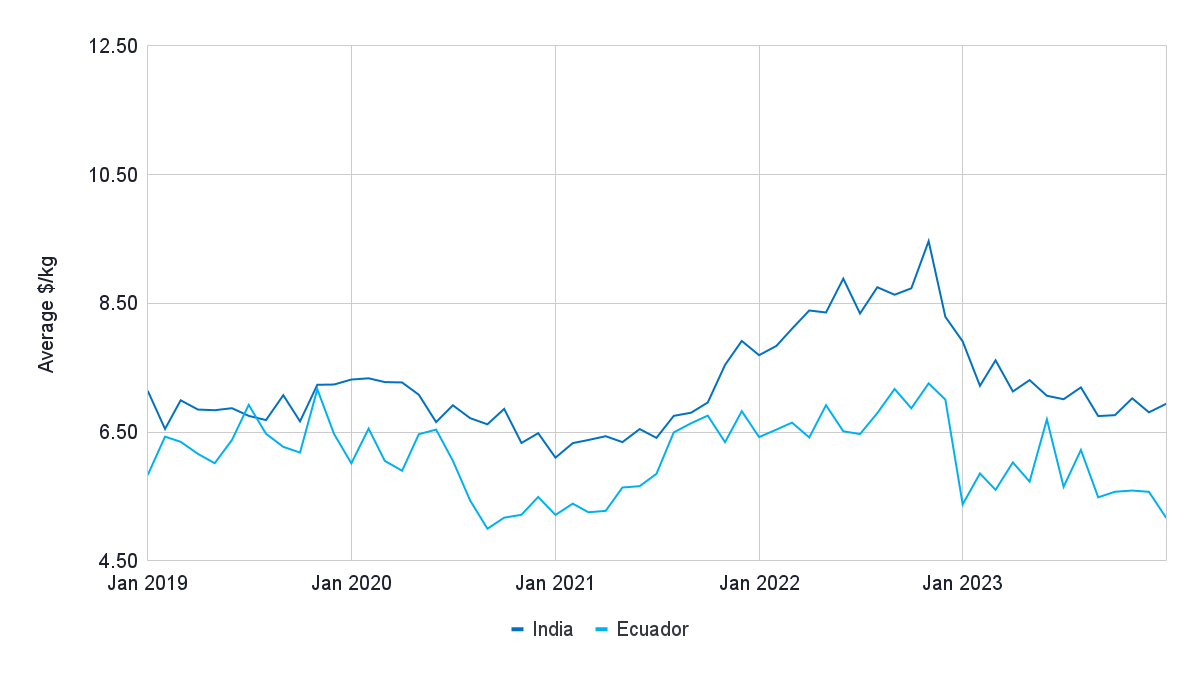
In 2023, the value of warm-water shrimp imports reached around $6.3 billion, 18% less than in 2022. Although the volume of shrimp imported into the US seemed to stabilize in the first two months of 2024, its value continued to decline. Total imports of warm-water shrimp reached $440 million in the first two months of 2024, 9% below 2023 and 34% below 2022. Looking at price trends of various countries, the average prices of Indian shrimp have dropped the most, from a peak of $10.21/kg in April 2022 to a low of $6.76/kg in February 2024.

China
Unlike the US, China’s shrimp imports increased continuously from 2020 to 2023; last year, they almost reached 1 million MT. Whether Chinese imports exceed 1 million MT in 2024 remains to be seen.
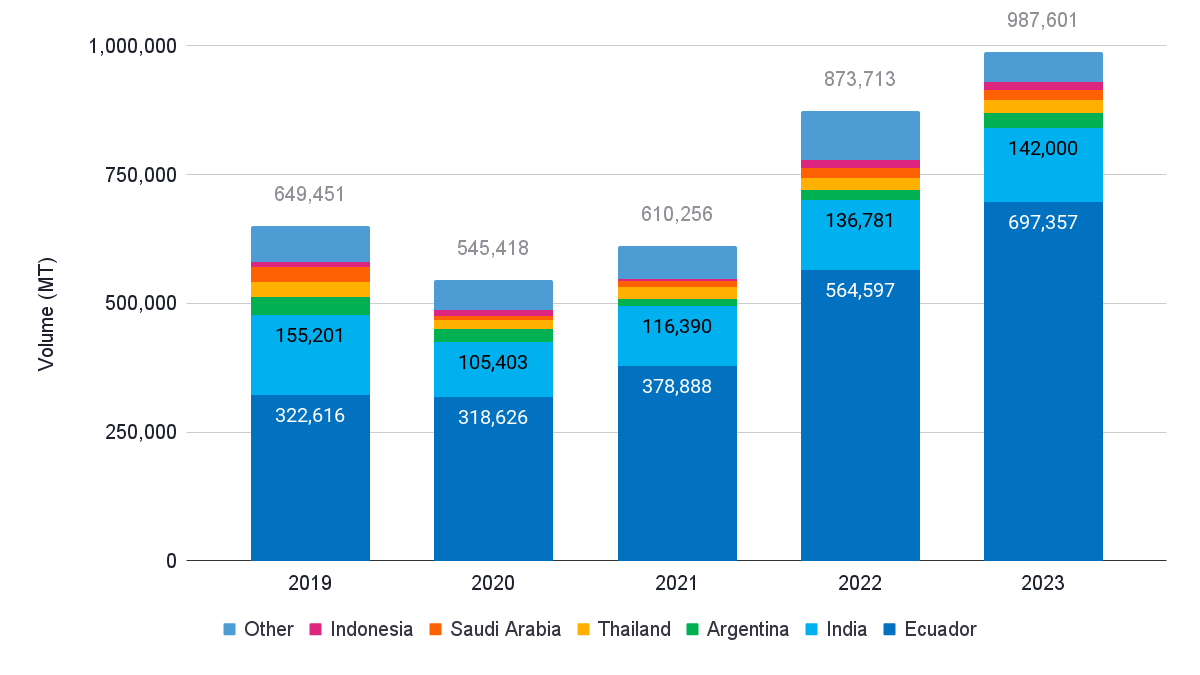
Source: Chinese Customs
In terms of suppliers, Ecuador continues to increase its market share. It grew from 50% in 2019 to 71% in 2023. In 2023, it exported almost 700,000 MT to China, easily double the amount from 2019. Remember that Ecuador primarily exports HOSO shrimp to China, in all its qualities. But some part of it is also HLSO. India supplies mainly HLSO blocks for reprocessing to China. These products are processed into value-added products for domestic and export markets. India’s exports gradually increased and are almost back to 150,000 MT. India’s market share, though, decreased from 24% in 2019 to 14% in 2023.
Source: Chinese Customs
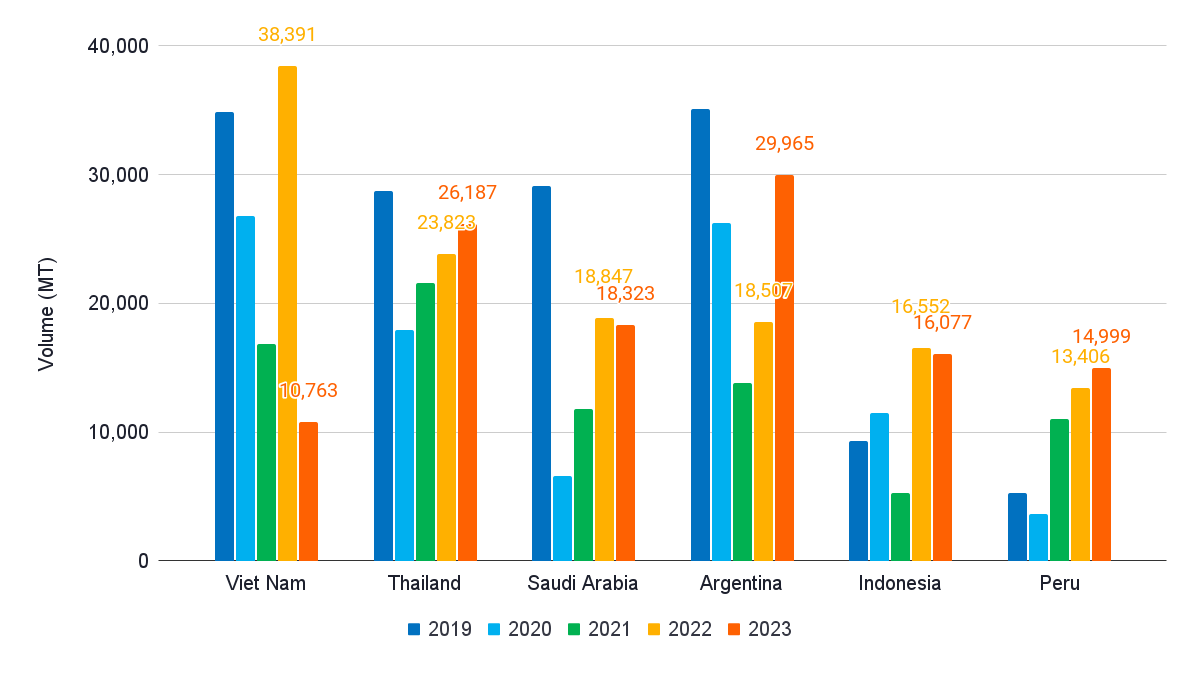
Due to the disproportionate market share of Ecuador and, to some extent, India, the supplies of other countries do not draw much attention when looking at statistics. However, there are some relevant trends. While supplies from Vietnam to China are highly volatile (assuming official statistics capture them), supplies from Thailand, Saudi Arabia, Argentina, Indonesia, and Peru have all seen a positive post-covid trend and seem to benefit from the recovery of China’s consumption as much as Ecuador and India, and in some cases, such as in the case of Argentina, relatively speaking, even more.

Source: Chinese Customs
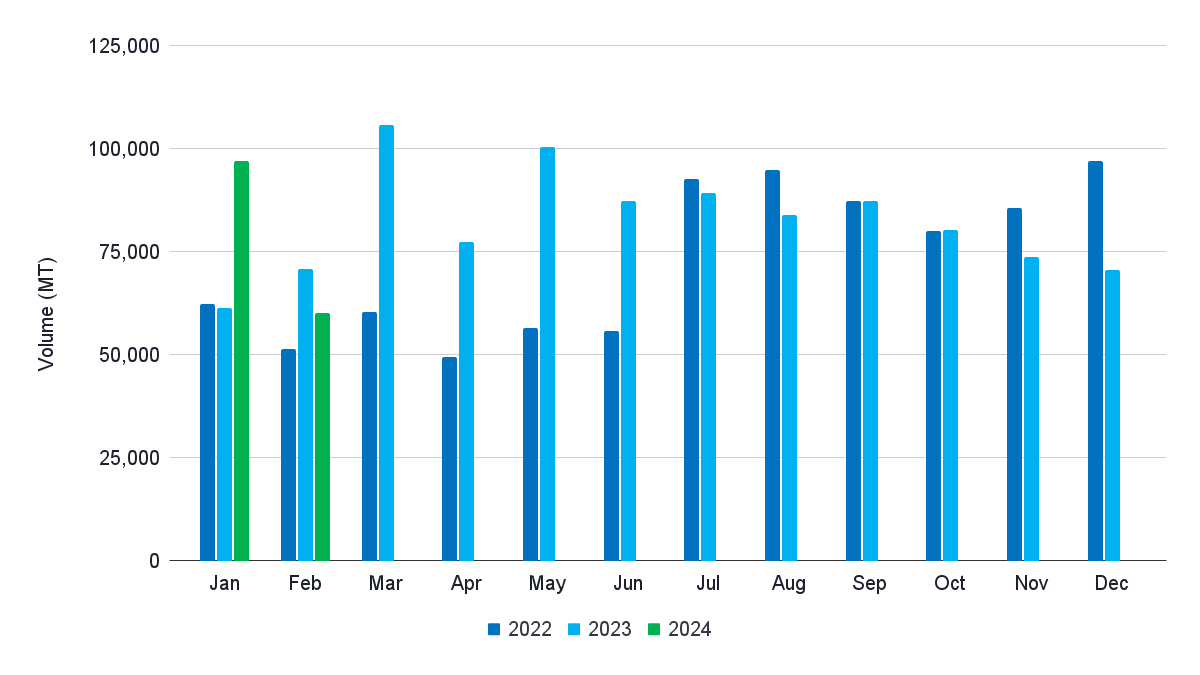
In January 2024, Chinese shrimp imports reached 97,144 MT, 59% more than in January 2023. In February 2024, imports reached 60,323 MT, 15% less than in February 2023. Combined, January and February imports increased 19% year-on-year to a new record of 157,377 MT. Whether Q1 2024 will be a new import record remains to be seen.
March 2023 was an all-time import record for China, exceeding 100,000 MT for the first time. Looking at Ecuador’s February 2024 export numbers, shipments to China declined 20% year-on-year. This means that China’s imports from Ecuador in March 2024 will likely also drop. However, whether that precisely means China’s Q1 total imports remains to be seen. With the current market situation in mind, including the current low prices, it’s likely that imports for at least the next few months will not exceed 2023’s numbers. If this is the case, we will have to wait at least another year to see China exceed 1 million MT imports.
Looking at Ecuador, China continued to increase imports in the first two months of 2024. China imported 114,717 MT of shrimp from Ecuador in January and February, 20% more than in 2023. Most of this volume was supplied in January, before the Chinese New Year, when supplies reached 72,484 MT, 84% more than in 2023. In February, Chinese imports from Ecuador dropped to 42,233 MT, 24% less than in 2023. However, as just mentioned, we may see China’s imports from Ecuador in March drop significantly compared to 2023.
China’s imports from India also increased. In January, China imported 12,746 MT of shrimp from India, 10% more than in 2023. Contrary to the drop in Ecuador's imports in February, imports from India increased year-on-year to 9,411 MT, up 50% from 2023. The total for the first two months 2024 is 21,156 MT, up 25% from 2023. India’s February export numbers are not yet in so we need to wait and see what the next few months will bring.
Source: Chinese Customs
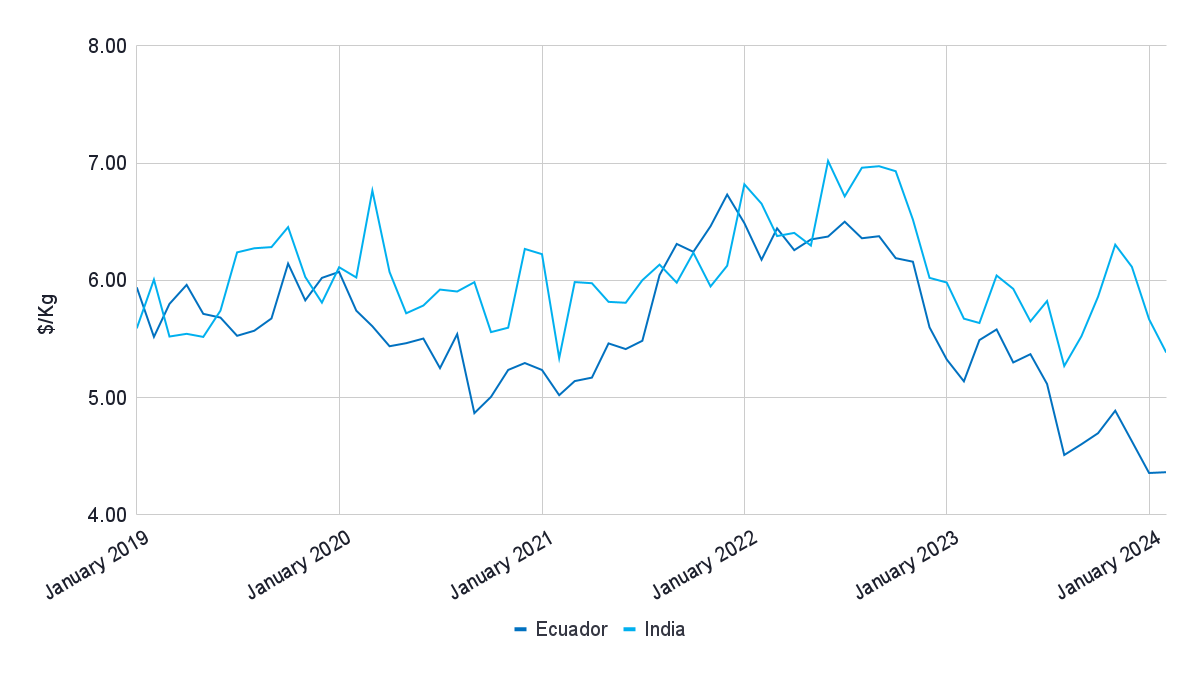
While the volume of shrimp exported to China in the first months of 2024 is impressive, the average value/kg remains worrisome. After an almost continuous price decline from mid-2022 to mid-2023, average values climbed for Ecuador and India from August to November 2023 but dropped once again. The average value/kg for Ecuador in January and February dropped to $4.36, the lowest ever. For India, the average value fell to $5.67 in January 2024 and $5.38 in February 2024, just above the lowest point of August 2023.

The EU
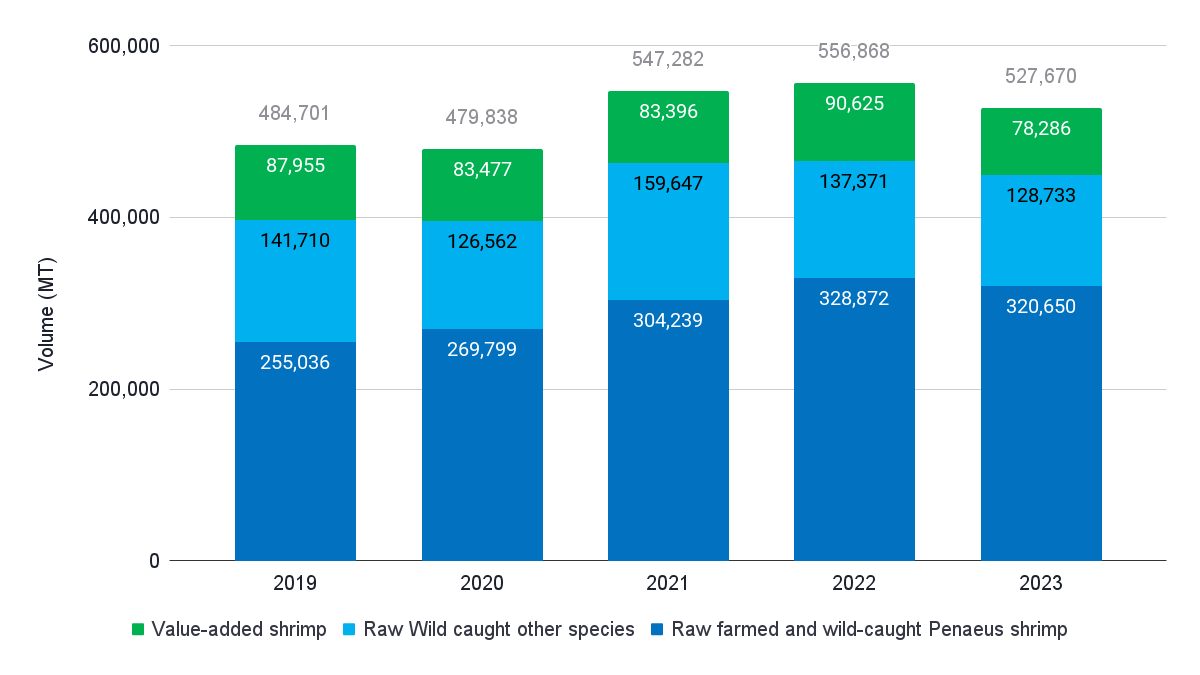
After a couple of years of post-covide growth, in 2023, the EU’s total shrimp imports (HS030617 and HS1605) dropped by 5% to 527,760 MT. Exports of value-added shrimp (all species included) fell the most, with 14%. In comparison, exports of (1) raw frozen farmed and wild-caught Penaeus shrimp (including P. monodon and L. vannamei) and (2) a combination of other wild-caught shrimp dropped by 2% and 6%, respectively.
Source: Eurostat
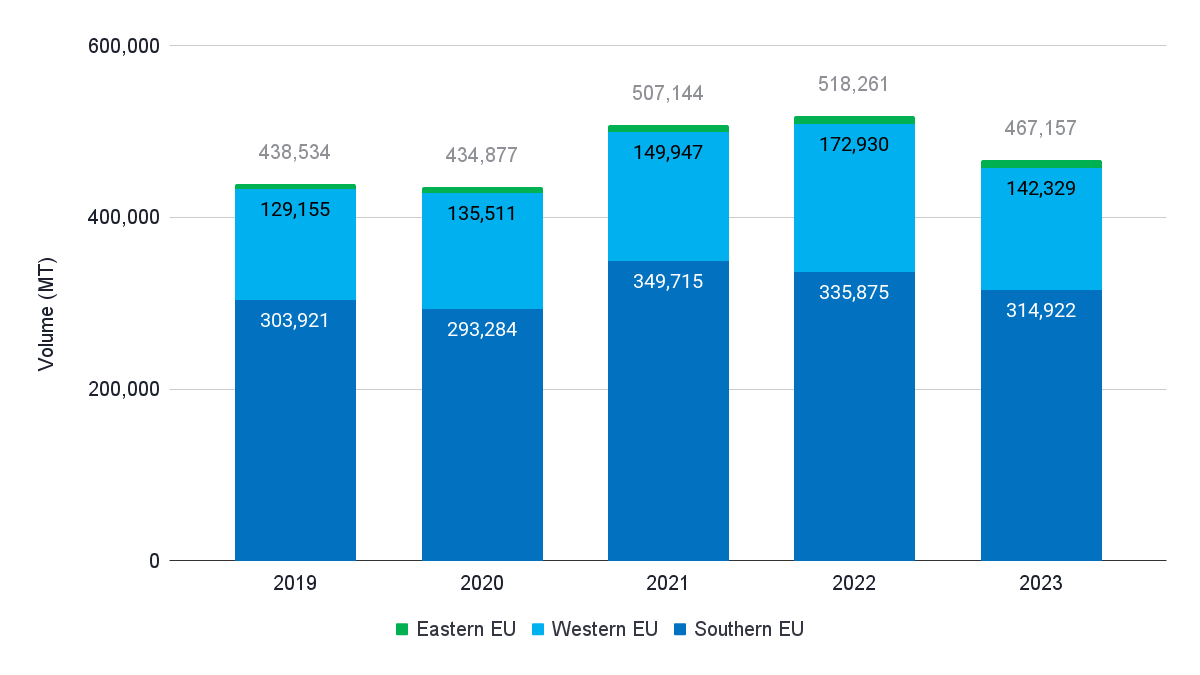
With 467,157 MT, shrimp imports from Africa, Asia, and Latin America account for 89% of total EU imports under HS 030617 and HS 1605. With 10%, imports from Africa, Asia, and Latin America dropped slightly more than the total; the Southern EU is the largest market, followed by the Western EU (including Scandinavia). Imports to the Southern EU dropped by just 6%, while exports to the Western EU fell by 18%.
Source: Eurostat
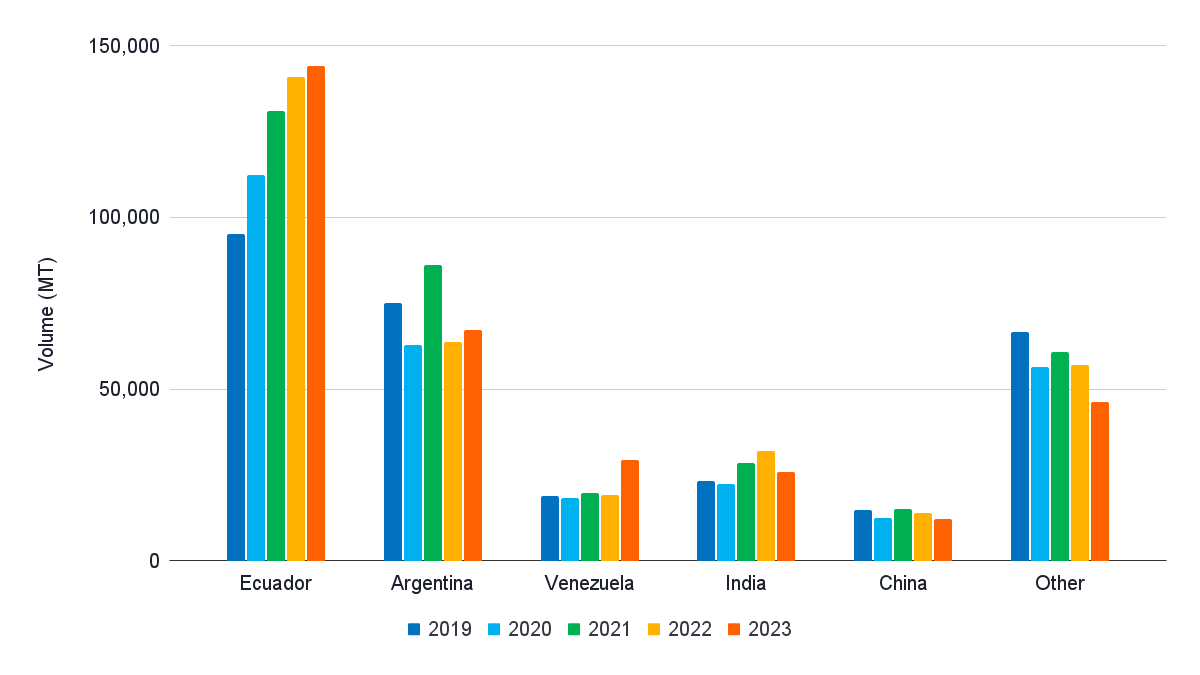
From Africa, Asia, and Latin America, Southern EU imports mainly HOSO shrimp. Besides farmed Penaeus shrimp, Southern EU also imports many Argentinian red shrimp. Argentina is Southern EU’s second-largest shrimp supplier after Ecuador. Ecuador further dominates the market and continues to grow its exports to the region, and the supply of L. vannamei shrimp seems to consolidate in its hands. While India was increasing exports to the Southern EU (mainly to France) from 2020-2022, in 2023, exports dropped. Also, other Asian suppliers, such as China and Vietnam, see a negative trend in Southern EU imports. From Latin America, only Venezuela seems to grow its market share. From 2022 to 2023, its exports jumped from 19,113 to 29,357 MT.

Source: Eurostat
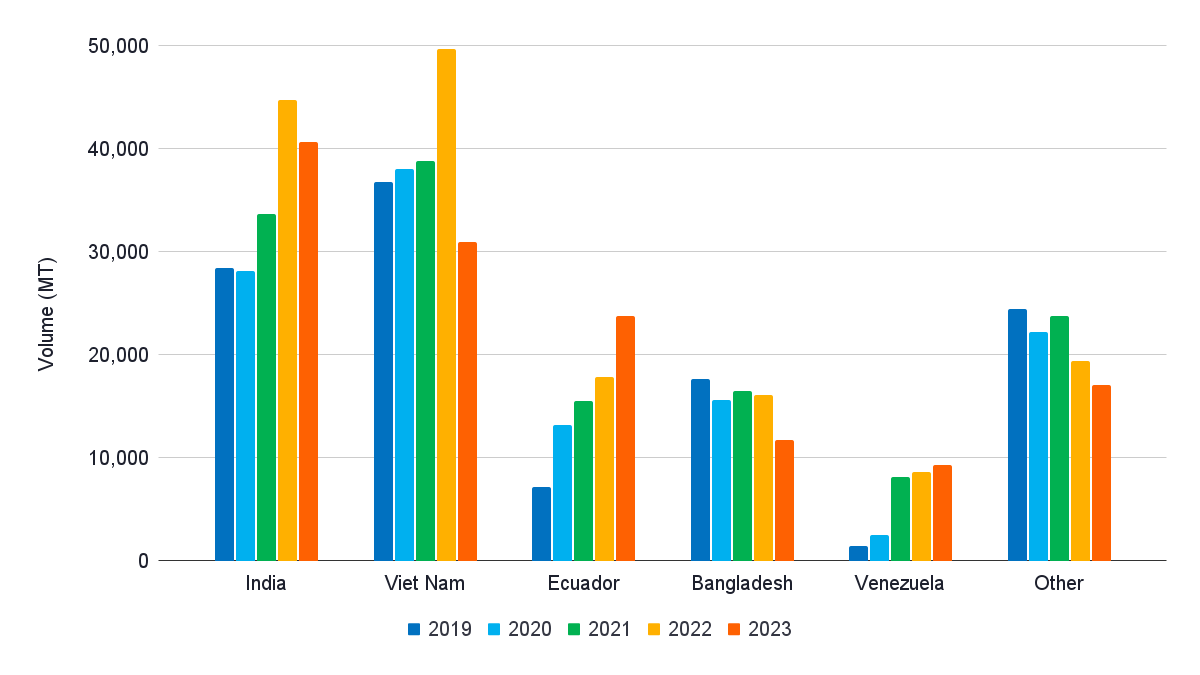
From Africa, Asia, and Latin America, Western EU imports a combination of raw frozen and value-added shrimp. The majority is peeled. The raw frozen shrimp combines mainly farmed Penaeus and other wild-caught species. The value-added shrimp comprises primarily cooked Penaeus shrimp. India dominates the supply of raw frozen shrimp, while Vietnam dominates supplies of value-added shrimp. In 2023, India took over from Vietnam as the Western EU’s largest shrimp supplier. Ecuador is gradually gaining market share and was, in 2023, the only supplier that significantly grew its imports in the Western EU. The category ‘other’ includes, among others, Indonesia, Honduras, Nigeria, and Guyana.
Source: Eurostat
With 3%, in January 2024, the EU’s shrimp imports from Africa, Asia, and Latin America slightly increased year-on-year. This indicates that imports may not fall much deeper this year. This is in line with indications from various large importers who all show slight optimism about this year’s demand. In January, Asia’s year-on-year drop in supplies (by 18%) and Latin America's increased imports (by 16%) continue. This is also related to the fact that in January 2024, imports in the Western EU dropped by 3% year-on-year while imports in the Southern EU increased by 5%.

Source: Eurostat
Average prices per kg only tell part of the overall EU imports, mainly because different member states import different products (HOSO vs peeled) and species (L. vannamei and P. monodon) across the EU. These cannot be distinguished in trade data. Nevertheless, the overall imports of HS03061792 still indicate that the average import value per kg of L. vannamei had a tough time in 2023 and that, at least for Ecuador, the bottom in January still needed to be reached.
Source: Eurostat
Next Up: Export Statistics
This blog focused on US, China, and EU imports. While the US and the EU saw imports drop from 2022 to 2023, Chinese imports continued to grow. In all markets, the continued growth of global shrimp output came at the cost of falling average prices. The first months of 2024 do not give a lot of promise that average prices have reached the bottom and may significantly improve any time soon. In the next blog, to be published in a couple of weeks, I will focus on export statistics from Ecuador, India, and other suppliers.