In September 2020, India’s shrimp export volume exceeded September 2019 by 1%. This was the first time since March that India’s exporters managed to exceed 2019’s monthly performance. Between March and August 2020, monthly exports were lagging behind 2019’s exports by an average of 19%. Overall, with 413,181 MT exported in 2020 so far, India’s exports are behind 2019 by 12%. In this blog, we’ll take a deep dive into India’s shrimp export in the first three quarters of 2020 and the outlook for the remainder of the year using the latest available broodstock import data. Will the last couple of months of 2020 make up for the losses sustained between March and August?
INDIAN EXPORT TREND IN 2020 SIMILAR TO 2019 BUT VOLUMES LAGGED BEHIND BETWEEN MARCH AND AUGUST
Although drivers behind the Indian export trends in 2019 are different from those in 2020, when comparing both years to 2018, the actual trend itself is so far rather similar (Figure 1). Compared to 2018, Indian exports in 2019 and 2020 had a strong start but fell behind 2018 in respectively April 2019 and March 2020. Exports only recovered in August 2019 and September 2020, exceeding 2018’s monthly figures.
Figure 1: Indian shrimp exports in 2018, 2019 and 2020 so far
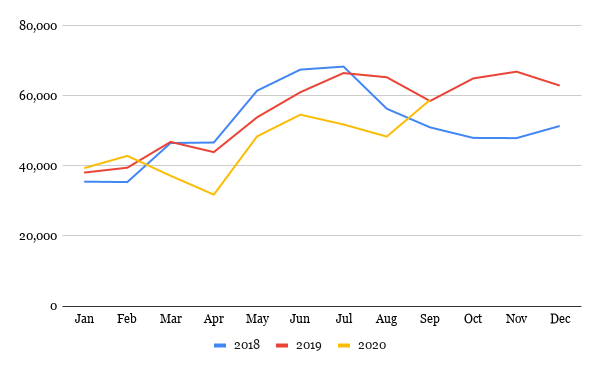
Source: Ministry of Commerce, India
The drop in exports between March and August is largely due to the performance of the first crop of the year. In 2018, farmers collectively stocked their ponds for the first crop in February, which they harvested from April onwards. Due to oversupply and a price crisis during the harvest of this first crop in 2018, farmers were reluctant to collectively stock in February a year later. Instead, many waited and stocked more spread out over the first half of the year and only stocked en masse once prices returned to a reasonable level. In February 2020, farmers anticipated better prices and were ready to stock, only to be affected by the Covid-19 lockdown. Ponds already stocked were harvested but idle ponds remained unused for several months.

Although 2020 followed the same trend as 2019, in absolute terms, exports fell behind, especially in March (21%) and April (28%), and in July (22%) and August (26%). In May and June exports fell behind by a mere 10%. While in September 2019, the year-total exports outperformed 2018 by 1%, in September 2020 the year-total was below that of 2018 and 2019 by respectively 12% and 13%.
While export volumes in September 2020 finally showed recovery and exceeded exports in September 2019 by 1%, it remains to be seen whether this trend will continue or whether India will even fall further behind 2018 and 2019 during the remainder of 2020. This of course relates to the performance of India’s second and third crop of the year.
BROODSTOCK IMPORTS PEAK BETWEEN JUNE AND SEPTEMBER AND MAY RESULT IN A CONSIDERABLE HARVEST TOWARDS THE END OF 2020
India’s broodstock import data on the performance of the first crop of 2020 shows a similar trend. Broodstock import figures in January-March 2018 were higher than those in 2019 and 2020. These imports catered to the first crop of 2018, leading to a bumper harvest and oversupply. In 2019, with farmers more reluctant to stock their ponds en masse during the first months of the year, broodstock imports stayed behind those of 2018. Early 2020, when the outlook for the year was more positive, broodstock imports increased compared to 2018, as hatchery operators anticipated strong demand from shrimp farmers.
Figure 2: Broodstock imports and RGCA BMC broodstock production figures
Source: Aquaculture Spectrum, India
Notes:
* The numbers presented in Figure 2 include broodstock imports and broodstock production by the RGCA BMC.
** The numbers presented in Figure 2 exclude broodstock production by the BMR Blue Genetics BMC, which doesn’t make its production figures publicly available.
*** February 2018 numbers are significantly higher than those of 2019 and 2020 due to a high production volume from the RGCA BMC in that month. If deducted, the number would be 28,000 broodstock, still above the level of February 2019 and 2020.
After the lockdown loosened in May, broodstock imports improved and peaked in June. While they then dipped again in July, in August and September imports outperformed previous years once again. Between May and September 2020, broodstock imports outperformed 2018 and 2019 by a solid 33% and 16% respectively. India’s export performance in 2019 clearly shows that the recovery of imports in May and June 2019 resulted in improved harvests and increased exports from September onwards.

September 2020 showed the same peak in exports and I believe that once again it was June’s broodstock imports that catered to this crop cycle. Assuming that broodstock imports indicate an upcoming crop, the peak in broodstock imports in August and September points to a rise in exports in October, November and December 2020, reaching levels similar to those in 2019.
When asking some of my contacts in India whether broodstock imports indeed can help to forecast a trend in production and exports they tend to agree. However, they also warn us to be cautious. First of all, they point out the high demand for small-sized shrimp from China. To cater to this demand, farmers tend to stock at higher densities and harvest at smaller sizes than they normally would. This results in a higher demand for post-larvae, which in turn requires hatcheries to import more broodstock. It also results in a relatively smaller export volume compared to if large sizes would be harvested.
My contacts also mention production losses due to heavy rains and disease outbreaks. These issues are believed to have led to production losses in several farming areas, resulting in lower production and exports than one might expect based on broodstock imports.
Taking these points to heart leads me to assume that exports in the last quarter of 2020 are unlikely to outperform those of 2019 and that I shouldn’t be too bullish based on broodstock import data alone. However, while some suggest that 2020’s total exports may be down by more than 20% compared to 2019, I believe this to be unlikely. By September, India was behind 2019 by only 12%. Based on the export data and broodstock import data of September 2020 combined with the arguments provided above, I foresee exports in the last quarter of 2020 to be at around the same level as in 2019. Taking into account a margin of 5%, this would mean that the year total of India’s shrimp exports would be down year-on-year by 8-17% compared to 2019 but still well above 2018’s exports.
DRIVEN BY US RETAIL DEMAND, EXPORTS OF COOKED AND VALUE-ADDED PRODUCTS INCREASE TO 33,000 MT (OR 8% OF INDIA’S TOTAL EXPORTS)
A lot has been said about the impact of Covid-19 on retail sales. Taking a quick detour, a closer look at India’s exports of cooked and value-added products reveals that India, too, benefited from this trend, especially in its exports to the US. With an increase of 8,000 MT resulting in a year-total of around 33,000 MT in September 2020, these export figures show a 35% growth compared to 2019.
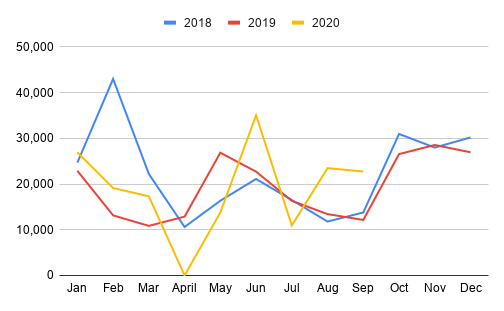
The most drastic increase in exports of cooked and value-added products started in June when they more than doubled in volume compared to 2019 (see Figure 3). Exports of cooked and value-added products continued to exceed 2019’s performance by 50%, 49% and 81% in July, August and September respectively. In September, it was the exports of these products that led to the 1% total year-by-year growth of the export volume. Exports of raw frozen shrimp in September were still down year-by-year by 4%.
Figure 3: Year-by-year growth rates of export volume from 2019 to 2020
Source: Ministry of Commerce, India
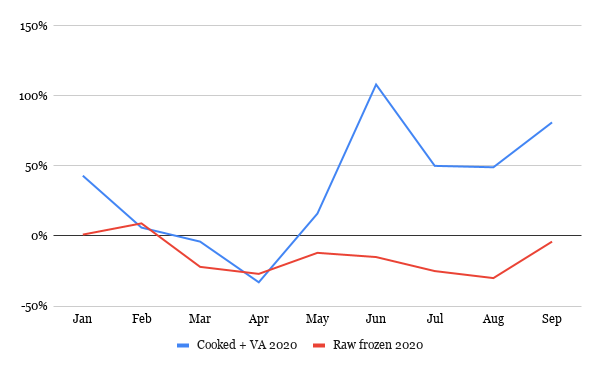
Demand for cooked products also drove the average price per kg (as seen from Figure 4). While the average value per kg of raw frozen shrimp exports has been below that of raw frozen shrimp in 2019 between May and August 2020, the average value per kg of cooked and value-added shrimp has exceeded 2019 ever since the first lockdown in the US earlier this year. The higher prices for cooked shrimp are a result of high demand from the US’s retail segment, while demand for raw frozen shrimp for the food service segment was lacking.
Figure 4: Average value ($) per kg of exported shrimp in 2019 and 2020
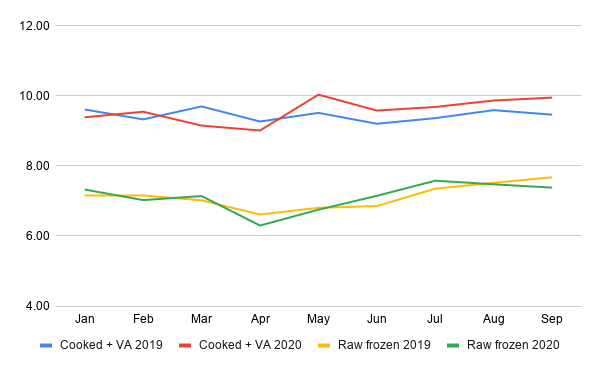
Source: Ministry of Commerce, India
While cooked shrimp only represents a small share of total exports, the product is certainly on the rise. But will India manage to keep its share of cooked products at this level once consumers can dine out again? Or will we see a slump in demand for cooked products in retail and lesser volumes and prices of Indian cooked shrimp?
CONCLUSION
Let me emphasize again that the current pandemic makes it particularly difficult to predict future supply and demand. But if my assumptions are correct and broodstock import numbers are a good indication of Indian shrimp production and exports, then India might export as much shrimp in the last quarter of 2020 as it did in the last quarter of 2019. One factor that could change this prediction is if the product is harvested in 2020, but instead of being exported immediately, is used to build inventory in India and is only exported to the US and China in the first months of 2021. If demand and competition keep raw material prices high till January, farmers will be encouraged to stock for a new crop early next year, which will result in a good summer crop in 2021.
A LITTLE EXTRA: BROODSTOCK SUPPLIERS IN 2020
Figure 5 provides an overview of monthly broodstock suppliers. Looking at the year total, Shrimp Improvement Systems is clearly India’s largest supplier with a 55% market share. Kona Bay occupies the second place with a 35% market share, and American Penaeid, Sea Products Development and SyAqua America, follow with a 3%, 2% and <1% market share respectively. This data excludes parent PL which are possibly supplied by Blue Genetics to the BMR Blue Genetics BMC as well as 450 P. monodon broodstock which have been supplied by Moana Technologies in September 2020 to Vaishnavi Aquatech, Gujarat.
Figure 5: Broodstock imports by supplier in 2020
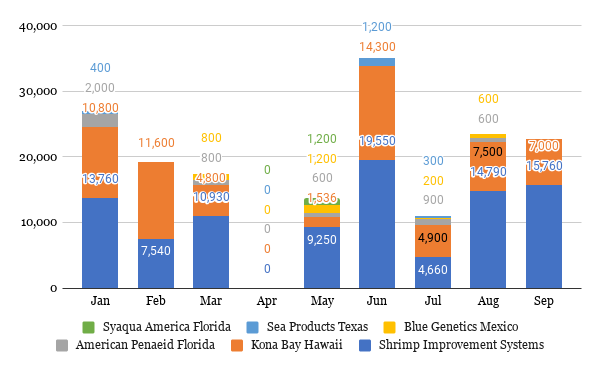
Source: Aquaculture Spectrum, India