During the first half of 2023, shrimp buyers and sellers worldwide have been suffering from slow consumer demand and low prices. In this blog, I will summarize the latest import data for the world’s four largest shrimp markets; the US, China, the EU, and Japan. In this relatively short blog you will find the necessary figures to draw your own conclusions and discuss how imports will develop in the second half of 2023 and beyond.
This is the second part of my mid-year trade data review. The first part, where I reported on exports from Ecuador, India, Vietnam, and Indonesia, was published in July.
In 2023, the Shrimp Blog is supported by: Inve Aquaculture, Taprobane Seafoods, DSM Animal Nutrition, Zeigler Nutrition, aquaconnect, Bioiberica, Megasupply, American Penaeid, and Omarsa.

The US
Import volume
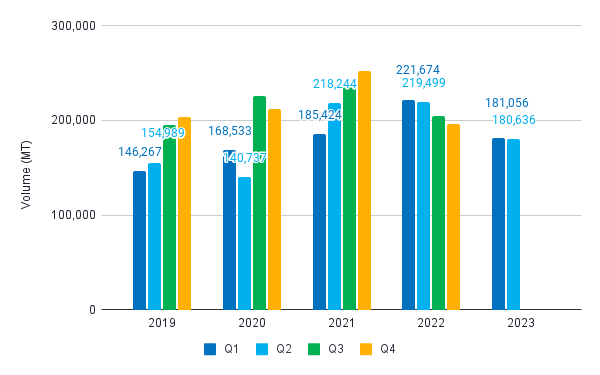
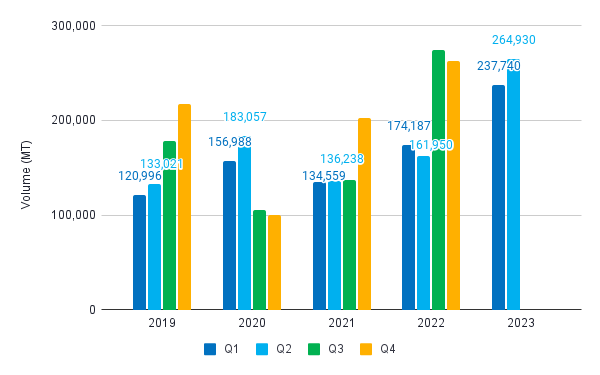
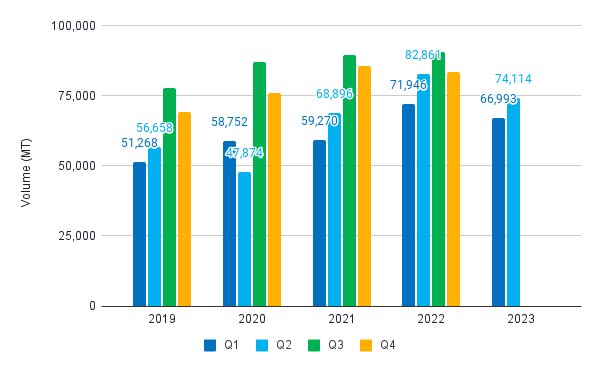
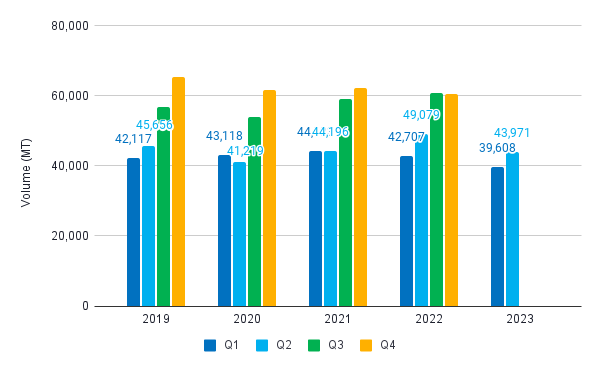
The US’s shrimp imports in the first half of 2023 reached 361,692 MT, down by 18% year-on-year. Although this was bad news for many suppliers to the US, a possible positive note is that the import volume stabilized from Q1 to Q2 and, for the first time since Q4 2021, didn’t significantly decline compared to the previous quarter. We’ll have to wait and see whether the US import volume follows an upward trend in the second half of the year, which used to be the norm before the oversupply situation became apparent in the second half of 2022.
Source: NOAA
Import value
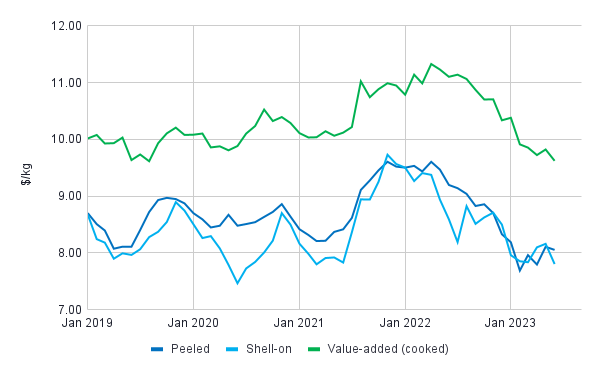
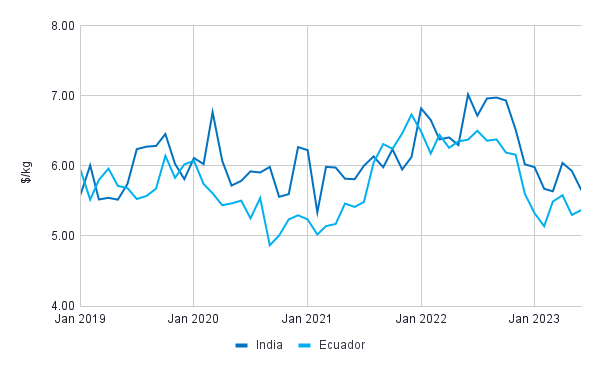
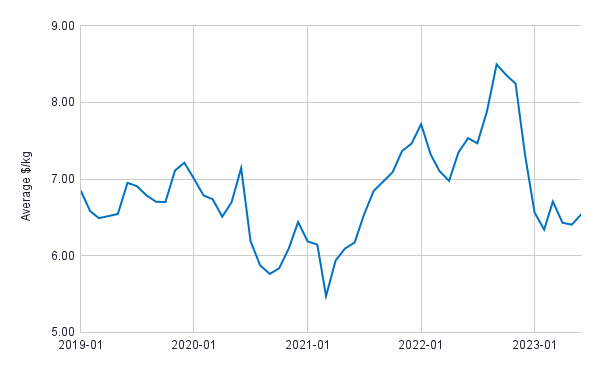
The average $/kg price of imported shrimp in early 2023 was at the same level as in 2019 amidst the COVID-19 crisis. During the pandemic, in the second half of 2020 and in 2021, prices surged, driven by strong retail sales and at-home consumption. Only in 2022, when today’s oversupply started, prices dropped. Today, the average price per kg for all product categories is around the same level of 2019 or just below it.
Source: NOAA
Products
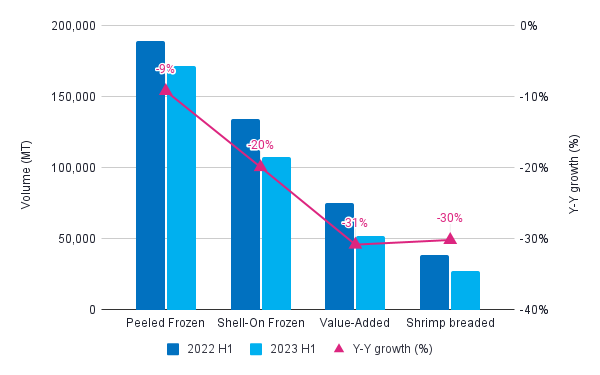
Between 2021 and 2022, US imports of peeled shrimp and shell-on shrimp dropped to 369,796 MT and 251,067 MT, respectively. This trend continued in the first half of 2023, when imports of both categories dropped further by 9% and 20% year-on-year. Contrary to these two most prominent import categories, imports of value-added (mostly cooked) and breaded shrimp between 2021 and 2022 increased to the record figures of 142,958 MT and 70,948 MT, respectively. This changed in the first half of this year when, year-on-year, imports of both categories dropped by around 30% each.
Source: NOAA
Suppliers
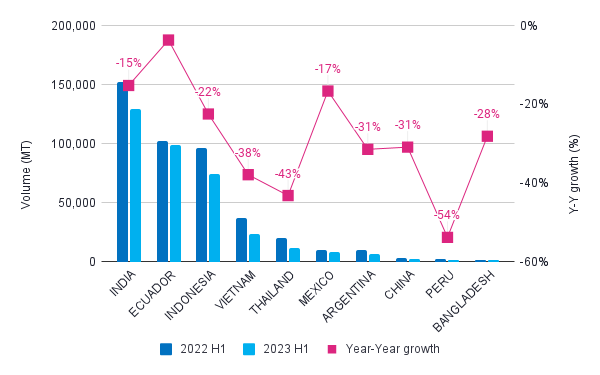
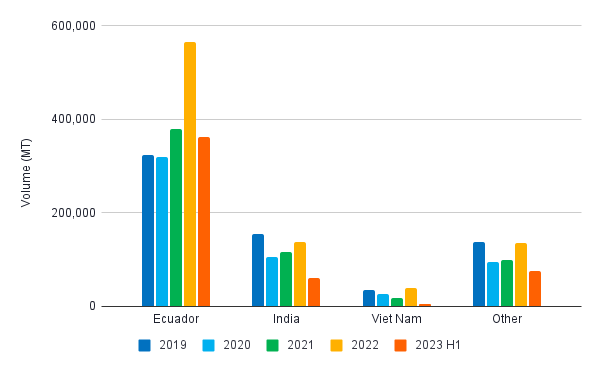
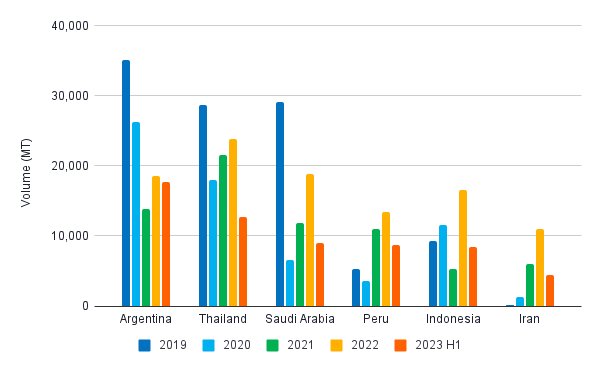
Most suppliers to the US already saw their volumes drop between 2021 and 2022, with the exception of Ecuador. At least until the first half of 2023, when Ecuador saw its export volume to the US drop year-on-year as well, if only by 4%—a fraction of the losses of its competitors.
Source: NOAA

China
Import volume
Leaving COVID-19 restrictions behind, China closed 2022 with a record import volume: in the second half of the year it surpassed 500,000 MT. During the first half of 2023, China’s imports settled just below those of the second half of 2022, but still above 500,000 MT.
With China’s current market and economic conditions, it’s unlikely that the import volume in the second half of 2023 will again grow year-on-year. However, if the country manages to match the volume of the second half of 2022, it may, for the first time, surpass 1 million MT of imported shrimp in 2023. With China’s July imports reported just slightly below those of July 2022, this might happen.
Source: Customs, China
Import value
In terms of total import value, China already imported $2.8bn of shrimp this year, 30% more compared to the first half of 2022. The average import price per kg also went up from around $5-5.5 at the peak of the COVID-19 crisis to about $6.5-7 in mid-2022. Then prices dropped to today’s levels due to oversupply. It’s still unclear whether the bottom has been reached.
Source: Customs, China

Suppliers
In recent years, Ecuador has been responsible for most of China’s import growth. In 2022, Ecuador’s supplies to China almost reached 600,000 MT. If this year’s trend follows that of last year, Ecuador’s exports to China may reach 900,000 MT.
Figures 7 and 8 also show imports from some of China’s other suppliers, such as India and Argentina. Over the past couple of years, India has slowly grown its exports to China year-on-year, but imports in the first half of 2023 seem slightly behind those of the first half of 2022. And Argentinian exports to China are fascinating to watch. In the first half of the year, Argentina exported as much shrimp to China as the 2022 year total. This year, Argentina may get back to somewhere around its 2019-2020 volumes, which would make it China’s third-largest supplier this year.
Source: Customs, China
Source: Customs, China

The EU
Import volume
Figure 9 shows EU imports of raw Penaeus shrimp (raw L. vannamei, P. monodon, and other Penaeus species reported under HS03061792). This is the main product category relevant for farmed shrimp. Although the market was slow, EU import volumes surprisingly only dropped 7% year-on-year in the first quarter. In April, the EU saw a steeper drop, with exports down 22% year-on-year, but this trend stopped in May. It resulted in the second quarter being down year-on-year by only 11%. In the first half of the year, the EU imported a total of 141,107 MT of Penaeus shrimp, down by 9% year-on-year.
Source: Eurostat
Import value
The EU’s average value per kg saw a steep increase during the pandemic and an even steeper drop at the end of 2022. In the first quarter of 2023, average prices had stabilized, but it’s unclear whether we’ll see a more positive trend in the nearby future.
Source: Eurostat

Products and markets
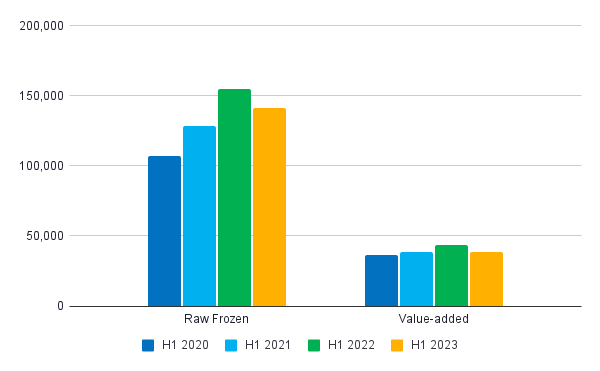
Besides raw frozen shrimp, the EU also imports value-added shrimp. The value-added category includes all shrimp species and all products that are processed in more than one step (such as peeled and cooked, or peeled and breaded). Around one-third of value-added shrimp volume is sourced from Asia. The remainder consists primarily of Northern pink shrimp from countries like Canada, the US, and Norway. In Asia, Vietnam dominates supplies (around 60%), followed at a distance by India, Indonesia and Bangladesh.
The value-added category has grown moderately in recent years (20% between 2020 and 2022), and in the first half of this year even declined by 13% year-on-year. Raw frozen Penaeus imports increased by 45% between 2020 and 2023, and in the first half of 2023 declined by 9% year-on-year.
Source: Eurostat
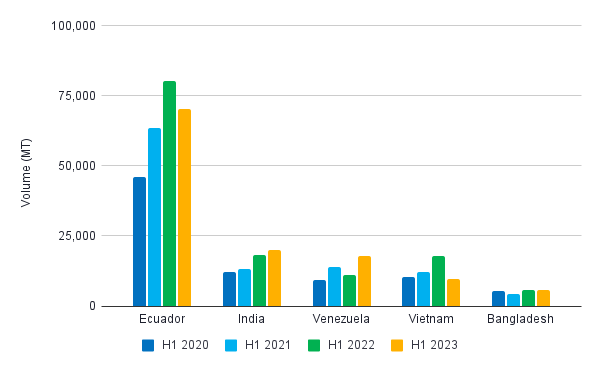
For some years, the EU saw a trend of increasing import volumes and market shares for Latin America and declining import volumes and market shares for Asia. However, since 2020, India and to some extent Vietnam have also benefitted from the EU’s surge in imports.
Looking at the performance in the first half of the year of the EU’s foremost suppliers of raw frozen Penaeus shrimp (Figure 12), we see that Ecuador’s exports to the EU dropped year-on-year, while India slightly increased its exports to the EU over the same period. India is increasingly focusing on the EU, most likely due to strong competition on the US market. As the results of a recent EU audit on India’s residue monitoring program were not too bad, it’s not unlikely that restrictions on India’s shrimp supplies to the EU will be softened and supplies from India will further increase over the next few years.
In the meantime, Venezuela has also increased its exports to the EU and has again taken up the third position among the EU’s major suppliers. We need to keep in mind that Venezuela not only ships HOSO products, but also a considerable volume of peeled products which is supplied to reprocessors in the Netherlands and Belgium, primarily for local processing and distribution into retail markets.
Source: Eurostat

Japan
Import volume
Japan imported 83,579 MT of shrimp in the first half of 2023, down by 9% year-on-year. The import volume in Q1 and Q2 was down by 7% and 10% year-on-year, respectively. Overall, the import trend is similar to previous years. We’ll have to wait and see whether Q3 and Q4 show a similar increase as Japan typically sees in the year’s second half. Today, there is no apparent reason to expect that year-total imports won’t increase towards 60,000 MT in Q3 and Q4 of 2023.
Source: Ministry of Finance, Japan
Import value
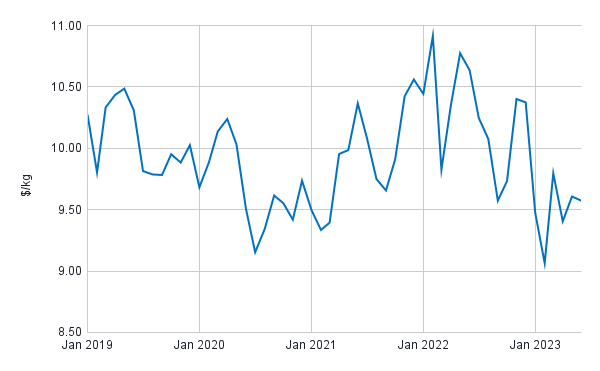
Japan’s import value in the first half of the year reached $823m, down by 18% year-on-year. Figure 14 shows that average prices per kg in Japan are much more volatile than in most other countries, but overall, Japan follows the same trend, with downward prices since early 2022.
Source: ITC Trade Map
Products and markets
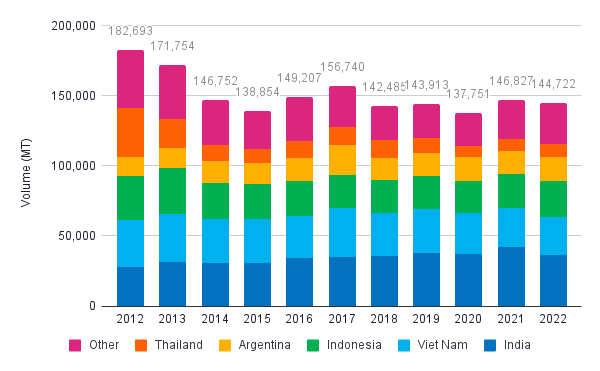
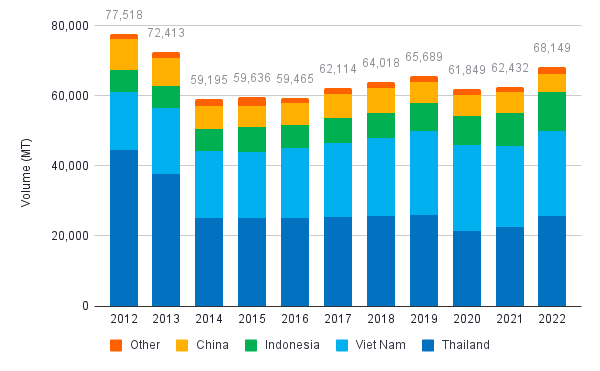
The most significant part of Japan’s imports is accounted for by raw frozen shrimp. It’s primarily sourced from countries like India, Vietnam, and Indonesia, but also from, for example, Argentina and Thailand (Figure 15). Interestingly, Thailand is still Japan’s largest supplier of value-added products (Figure 16), probably one of the few market segments in which Thailand still holds a significant position.
Market shares among Japan’s suppliers are relatively stable, a sign of Japan’s long-term relationships, supplier agreements, and sometimes even JV operations with suppliers. In many factories that do considerable business with Japan, Japanese QA managers are on-site to ensure that product specifications meet expectations. For these reasons, Japanese buyers don’t take switching suppliers lightly.
Source: ITC Trade Map
Source: ITC Trademap

Conclusion
Let me end with a summary of my thoughts about the data presented and other contextual information:
- In the US, the world’s biggest market, imports dropped most considerably compared to other markets.
- US importers have had to work through their high-priced inventories or accept losses on those stocks before they could replace them.
- US retailers didn’t start significant shrimp promotions in their stores. Instead, they accepted lower sales volumes while maintaining prices to achieve desired margins. This resulted in a substantial price gap between wholesale and retail prices.
- Although imports will likely show an upward trend as we usually see towards the end of the year, I’m not convinced that we’ll see an increase in imports year-on-year. Nevertheless, the year-on-year drop in imports may be slightly less than in the first half of 2023 because imports were already dropping from the second half of 2022.
- In 2023, China may for the first time achieve a calendar year import volume of over 1 million MT.
- China already reached 1 million MT imports over the last two quarters of 2022 and the first two quarters of 2023. This was mainly due to the import volume jump from the first half to the second half of 2022 and the stabilization of import volumes in the first half of 2023.
- Due to China’s current economy, it’s unlikely that we’ll see another steep year-on-year increase in the second half of 2023. Especially having in mind that imports from the second half of 2022 to the first half of 2023 stabilized at around 500,000 MT.
- With China’s imports in July only being down by 3% year-on-year, there’s good reason to assume that the country will indeed approach the 500,000 MT import volume from the second half of 2022 and achieve a new record of 1 million MT imports per calendar year.
- With its decline of only 9%, the EU’s import volume is down less than one may have expected based on industry rumors, especially compared to the US’s 18% year-on-year decline in the first half of the year.
- Imports of raw frozen Penaeus shrimp may stabilize at 300,000 MT.
- EU imports of raw Penaeus shrimp from Ecuador in the first half of 2023 dropped by 13%, more than the total import volume drop of 9%. In the meantime, imports from India were up by 10% year-on-year. Imports from Venezuela were even up by 60%, while those from Vietnam were down by 46%, making Venezuela once again the number three supplier to the EU. Vietnam remains the largest supplier of value-added products.
- With EU inventories reportedly lower than in the US, EU imports will likely keep following an upward trend towards the end of the year. However, keeping in mind the economic situation, it’s unlikely that we’ll see a year-on-year increase. Rather, we should expect the EU’s year-total of raw Penaeus imports to be down by around 10% and settle at around 300,000 MT.
- Japan’s imports were also only down by 9% year-on-year in the first half of 2023.
- Japan follows a growth trend that is opposite from that of most other markets. Over the last decade, imports dropped from 300,000 MT to 200,000 MT. If this year’s trend continues, imports may settle at around 180,000 MT.
- Looking at Japan’s suppliers, there are a few notable changes: India, Vietnam, and Indonesia dominate supplies of raw frozen shrimp, while Thailand, Vietnam, and Indonesia dominate supplies of value-added products.
- Ecuador is slowly growing exports of raw frozen shrimp to Japan. Whether Ecuador’s growth will accelerate with Mitsui’s investment in Santa Priscila remains to be seen.